Translate this page into:
Clinical features, laboratory tests and risk factors in patients with erythrodermic psoriasis complicated with systemic infection: A retrospective study
Corresponding author: Dr. Guan Jiang, Department of Dermatology, Affiliated Hospital of Xuzhou Medical University, Xuzhou, China. dr.guanjiang@xzhmu.edu.cn
-
Received: ,
Accepted: ,
How to cite this article: Sun D, Zhang Y, Jiang G. Clinical features, laboratory tests and risk factors in patients with erythrodermic psoriasis complicated with systemic infection: A retrospective study. Indian J Dermatol Venereol Leprol. 2025;91;S8-S12. doi: 10.25259/IJDVL_678_2023
Dear Editor,
Psoriasis is a chronic inflammatory dermatosis with immune-mediated polygenic defects. Erythrodermic psoriasis (EP) is one of its severe variants which is not uncommon in Asian populations1 and has a high mortality rate.2 Recently, several authors have highlighted the important role of infections in its occurrence and development. However, few studies exist to identify the risk-factors associated with infection in these patients, especially studies targeting severe EP, clinical features, and laboratory markers associated with infection. This project investigated clinical features, laboratory tests, and related factors of EP patients with systemic infections by retrospectively analysing their medical records, which were retrieved from the Affiliated Hospital of Xuzhou Medical University. The probability of EP patients merging with infections is high and types are diverse. Joint pain/pustules, smoking history, hyperglycemia, and hypoproteinemia are related factors for EP combined with infection. C-reactive protein, systemic immune inflammation index, α-1 acidic glycoprotein, N-terminal B-type natriuretic peptidogen, albumin, cholinesterase, and total cholesterol are new indicators for diagnosing EP with infection, and the regression predicted values performs better.
The hospital information system (HIS) of the Department of Dermatology of the Affiliated Hospital of Xuzhou Medical University was searched and all relevant medical records for EP were reviewed from January 2012 to December 2022. Finally, we included 105 inpatients with EP and concomitant infection in our study. Our study has been approved by the Medical Ethics Committee of Xuzhou Medical University Affiliated Hospital with opinion number XYFY2022-KL454-01.
This study used retrospective analysis methods to collect data from all included patients, including basic demography, clinical characteristics, and laboratory findings. We included the results of the first test only in patients who underwent multiple tests for the same item. All data was organised for statistical analysis using Software SPSS26.0.
Chi-square test, continuous corrected chi-square test, independent sample t-test, corrected t-test, Mann–Whitney U test, and unconditional logistic regression were used. The test level α was defined as 0.05 and P<0.05 was considered statistically different and P<0.01 was considered to be significantly different in the distribution between both groups. Receiver Operating Characteristic (ROC) curve was analysed and drawn by the software GraphPad Prism 9.
Excluding 32 suspected infections, 105 hospitalised patients with EP were finally included in this study with a total of 62 patients with systemic infection and 43 patients without systemic infection with an overall infection rate of 45.3%. Various types of infections may complicate EP, respiratory infections being the most frequent [Table 1].
| Type/pathogen | Number | Scale % (n=62) |
|---|---|---|
| Bloodstream infections | 12 | 19.4 |
| Skin infections | 7 | 11.3 |
| Respiratory infections | 26 | 41.9 |
| Hepatitis | 3 | 4.8 |
| Tuberculosis | 2 | 3.2 |
| Urinary tract infections | 9 | 14.5 |
| Periodontitis | 1 | 1.6 |
| Gastroenteritis | 2 | 3.2 |
| Co-infection | 11 | 17.7 |
| Staphylococcus haemolyticus | 7 | 11.29 |
| Staphylococcus epidermididis | 4 | 6.45 |
| Staphylococcus aureus | 2 | 3.23 |
| Methicillin-resistant Staphylococcus aureus | 4 | 6.45 |
| Varicella-zoster virus | 1 | 1.61 |
| Herpes simplex virus | 2 | 3.23 |
| Coxsackie group B virus | 6 | 9.68 |
| Adenovirus | 5 | 8.06 |
| Cytomegalovirus | 1 | 1.61 |
| Human herpesvirus type IV (EBV) | 2 | 3.23 |
| Respiratory syncytial virus | 2 | 3.23 |
| Hepatitis B virus | 2 | 3.23 |
| Hepatitis C virus | 1 | 1.61 |
| Mycoplasma pneumoniae | 6 | 9.68 |
| Divergent tuberculosis bacillus | 2 | 3.23 |
EBV- Epstein-Barr virus.
In order to explore the related factors for concomitant systemic infections in EP, we involved the indicators of more than 90 cases in the infected and the non-infected groups into the unconditional logistic regression analysis, including demography, medical history characteristics, and some baseline laboratory investigations. For all variables included in the regression analysis, the regression model automatically excluded patients who are missing any one variable. Among the 105 EP, 10 EP patients were excluded, and 95 patients were included in the regression analysis, of which 56 were infected and 39 were not. The final results showed that joint pain and/or pustule symptoms, smoking history, hyperglycaemia, and hypoproteinaemia were related factors for EP combined with systemic infection. The results of univariate and multivariable analysis of EP combined systemic infection are shown in Table 2. The analysis method used Forward LR.
| Factor | Univariate analysis | Multivariable analysis | |||||
|---|---|---|---|---|---|---|---|
| OR | 95% CI | P | OR | 95% CI | P | ||
| Gender | Man | 1 | |||||
| Woman | 2.829 | 1.080–7.405 | 0.034 | ||||
| Age (years) | <60 | 1 | |||||
| ≥60 | 0.720 | 0.329–1.577 | 0.412 | ||||
| Admission season | Non-seasonal | 1 | |||||
| Seasonal | 2.58 | 1.023–6.506 | 0.045 | ||||
| History of smoking | not | 1 | |||||
| Yes | 2.937 | 1.066–8.092 | 0.037 | 7.641 | 1.716–34.025 | 0.008 | |
| Arthralgia/pustules | not | 1 | |||||
| Yes | 2.937 | 1.066–8.092 | 0.037 | 5.140 | 1.200–22.011 | 0.027 | |
| Number of comorbidities | <3 | 1 | |||||
| ≥3 | 2.634 | 1.003–6.917 | 0.049 | ||||
| Conscious symptoms | Light/None | 1 | |||||
| Itching | 0.689 | 0.284–1.674 | 0.411 | ||||
| Pain | 1.063 | 0.309–3.659 | 0.923 | ||||
| Blood glucose | Not high | 1 | |||||
| Elevated | 4.800 | 1.292-17.839 | 0.019 | 7.290 | 1.293–41.109 | 0.024 | |
| Hypoproteina-emia | Not | 1 | |||||
| Yes | 10.543 | 3.996-27.817 | <0.001 | 19.234 | 5.380–68.761 | <0.001 | |
| Psoriasis course | 0.979 | 0.954–1.005 | 0.120 | ||||
| Erythroderma course | 1.000 | 0.986–1.014 | 0.987 | ||||
OR: odds ratio, CI: confidence interval.
By comparing the data differences between the EP infected group and non-infected group, we detected inter-group differences pertaining to the following laboratory characteristics: Neutrophil Count (NEUT), C-Reactive Protein (CRP), Systemic Immune-inflammation Index (SII), Alpha-1 Acidic Glycoprotein (AAG), D-Dimer (D-D), N-Terminal pro-B-type Natriuretic Peptide (NT-ProBNP), Aspartate Transaminase (AST), Alanine Transaminase (ALT), Glutamyl Transferase (GGT), Albumin (ALB), Cholinesterase (CHE), Serum potassium (K), Serum phosphorus (P), Serum sodium (Na), Serum chloride (Cl), Serum calcium (Ca), Blood glucose (GLU), Low-Density Lipoprotein cholesterol (LDL-c), Total Cholesterol (TC). The remaining indicators were comparable, as shown in Table 3.
| Variable | Infection group | Non-infected group | Statistic | P | |
|---|---|---|---|---|---|
| Neutrophil count (10^9/L) | 7.6 (6.5) | 4.6 (2.7) | −4.657 | <0.001** | |
| Lymphocyte count (10^9/L) | 1.5 (1.0) | 1.6 (0.8) | −1.300 | 0.193 | |
| Platelet count (10^9/L) | 293.8±116.5 | 276.1±87.9 | 0.837 | 0.404 | |
| C-reactive protein (mg/L) | 60.6 (96.2) | 12.5 (26.8) | −4.511 | <0.001** | |
| Systemic immune-inflammation index (10^9/L) | 1340.0 (1629.8) | 739.3 (501.4) | −4.415 | <0.001** | |
| Alpha-1 acidic glycoprotein (mg/dl) | 148.0 (111.7) | 121.0 (60.9) | −2.142 | 0.032* | |
| D-Dimer (μg/mL) | 2.3 (3.8) | 1.1 (1.7) | −2.360 | 0.016* | |
| N-Terminal pro-B-type natriuretic peptide (pg/mL) | 614.8 (1412.0) | 183.0 (470.9) | −2.022 | 0.043* | |
| Albumin (g/L) | 31.6±5.9 | 37.1±4.4 | −5.439 | <0.001** | |
| Cholinesterase (U/L) | 4731.5±1988.8 | 6221.3±2056.5 | −3.659 | <0.001** | |
| Aspartate transaminase | normal | 45 (73.8) | 36 (90.0) | 4.007 | 0.045* |
| abnormal | 16 (26.2) | 4 (10.0) | |||
| Alanine transaminase | normal | 47 (77.0) | 38 (92.7) | 4.315 | 0.038* |
| abnormal | 14 (23.0) | 3 (7.3) | |||
| Glutamyl transferase | normal | 47 (77.0) | 38 (95.0) | 5.839 | 0.016* |
| abnormal | 14 (23.0) | 2 (5.0) | |||
| Serum potassium | normal | 47 (75.8) | 39 (95.1) | 6.682 | 0.010* |
| abnormal | 15 (24.2) | 2 (4.9) | |||
| Serum sodium | normal | 42 (67.7) | 39 (95.1) | 11.015 | 0.001** |
| abnormal | 20 (32.3) | 2 (4.9) | |||
| Serum chloride | normal | 41 (66.1) | 41 (100.0) | 17.444 | <0.001** |
| abnormal | 21 (33.9) | 0 (0.0) | |||
| Serum calcium | normal | 27 (43.5) | 28 (68.3) | 6.072 | 0.014* |
| abnormal | 35 (56.5) | 13 (31.7) | |||
| Serum phosphorus | normal | 45 (73.8) | 37 (90.2) | 4.221 | 0.040* |
| abnormal | 16 (26.2) | 4 (9.8) | |||
| Low density lipoprotein cholesterol | normal | 32a (62.7) | 29a (93.5) | 10.501 | 0.001** |
| elevated | 4a (7.8) | 2a (6.5) | |||
| lower | 15b (29.4) | 0b (0.0) | |||
| Total Cholesterol | normal | 37a (67.3) | 31a (91.2) | 6.881 | 0.009* |
| elevated | 2a,b (3.6) | 1a,b (2.9) | |||
| lower | 16b (29.1) | 2b (5.9) | |||
| Blood glucose | not elevated | 40 (71.4) | 36 (92.3) | 6.264 | 0.012* |
| elevated | 16 (28.6) | 3 (7.7) |
Platelet count, albumin and cholinesterase conform to the normal distribution and the t-tests were used. The remaining quantitative indicators do not conform to the normal distribution and the non-parametric test is used. The chi-square test is used for categorical variables and the non-parametric test is used for graded variables. Low density lipoprotein cholesterol and Total cholesterol are further compared in pairs and the same letter subscript indicates that there is no difference between the two pairs. * indicates a statistical difference in distribution between the two groups. ** indicates a significant difference.
The ROC curve was used to verify the diagnostic performance of some laboratory investigations to indicate infection in EP. The Jordon index (sensitivity + specificity -1) corresponding to each cut-off value was calculated and the point with the largest Jordon index was considered the best cut-off value.
Scatter plots, the ROC curve, and its parameters including CRP, SII, AAG, NT-ProBNP, ALB, CHE, and TC are shown in Figures 1–2. Table 4 shows the comparison of P-values before and after adjusting for age, EP course, and body mass index using covariance for each biomarker. Through the accuracy test of the single index for the diagnosis of EP infection, we found that the comprehensive diagnostic values of CRP, SII, and ALB were high and the AUCs were greater than 0.75. TC has high specificity for diagnosing infection. The four indexes are included in multivariate regression analysis to obtain its joint predictive value and its diagnostic performance is tested.. As shown by the red curve in Figure 1, the AUC for the diagnosis of EP infection with the joint predictive value is 0.903 which is greater than any single indicator and the best cut-off value is 0.6895 with sensitivity of 79.6% and specificity of 96.15%. This regression predictive value is a relatively ideal diagnostic index, but more sample verification is needed.
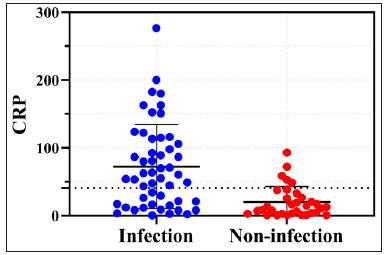
- Scatter plots of lab test values in infected vs. non-infected erythrodermic psoriasis patients. Blue dots (infected) and red dots (non-infected) indicate C-reactive protein values. Dotted line at 40.9 denotes optimal cut-off; above this, infected individuals dominate.

- Scatter plots of lab test values in infected vs. non-infected erythrodermic psoriasis patients. Blue dots (infected) and red dots (non-infected) indicate systemic immune-inflammation index values. Dotted line at 926.9 denotes optimal cut-off; above this, infected individuals dominate.

- Scatter plots of lab test values in infected vs. non-infected erythrodermic psoriasis patients. Blue dots (infected) and red dots (non-infected) indicate albumin values. Dotted line at 33.45 denotes optimal cut-off; below this, infected individuals dominate.

- Scatter plots of lab test values in infected vs. non-infected erythrodermic psoriasis patients. Blue dots (infected) and red dots (non-infected) indicate cholinesterase values. Dotted line at 5406 denotes optimal cut-off; below this, infected individuals dominate.

- Scatter plots of lab test values in infected vs. non-infected erythrodermic psoriasis patients. Blue dots (infected) and red dots (non-infected) indicate N-terminal pro-B-type natriuretic peptide values. Dotted line at 526.5 denotes optimal cut-off; above this, infected individuals dominate.

- Scatter plots of lab test values in infected vs. non-infected erythrodermic psoriasis patients. Blue dots (infected) and red dots (non-infected) indicate alpha-1 acidic glycoprotein values. Dotted line at 169 denotes optimal cut-off; above this, infected individuals dominate.

- Scatter plots of lab test values in infected vs. non-infected erythrodermic psoriasis patients. Blue dots (infected) and red dots (non-infected) indicate total cholesterol values. Dotted line at 3.295 denotes optimal cut-off; below this, infected individuals dominate.

- Scatter plots of lab test values in infected vs. non-infected erythrodermic psoriasis patients. Blue dots (infected) and red dots (non-infected) indicate regression predictive value of CRP, SII, ALB and TC, which abbreviated as prediction. Dotted line at 0.6895 denotes optimal cut-off; above this, infected individuals dominate.

- ROC curves of laboratory indicators diagnosis of EP is complicated with infection. The yellow curve shows the ROC curve of CRP for the diagnosis of EP infection. The sensitivity is 64.7%, specificity is 84.8%, the area under the curve (AUC) is 0.793 and the 95% confidence interval (CI) is (0.698, 0.887). The orange curve shows the ROC curve of ALB. The sensitivity is 67.2%, specificity is 87.5%, AUC is 0.771, and 95%CI is (0.679, 0.862). The green curve shows the ROC curve of SII. The sensitivity is 72.9%, specificity is 72.1%, AUC is 0.757, and 95% CI is (0.664, 0.850). The dark green curve shows the ROC curve of CHE. The sensitivity is 65.6%, specificity is 70.7%, AUC is 0.708, and 95%CI is (0.607, 0.809). The blue curve shows the ROC curve of AAG. The sensitivity is 43.2%, specificity is 100%, AUC is 0.683, and 95%CI is (0.544, 0.822). The purple curve shows the ROC curve of NT-proBNP. The sensitivity is 54.3%, specificity is 80.0%, AUC is 0.682, and 95%CI is (0.520, 0.844). The pink curve shows the ROC curve of TC. The sensitivity is 40.0%, specificity is 94.1%, AUC is 0.640, and 95%CI is (0.527, 0.753). The red curve shows the ROC curve of prediction, which referred to the regression predictive value of CRP, SII, ALB, and TC. The sensitivity is 79.6%, specificity is 96.15%, AUC is 0.903, and 95%CI is (0.833, 0.973). The AUC is greater than any single indicator’s performance. (CRP: C-Reactive Protein, ALB: Albumin, SII: Systemic Immune-inflammation Index, CHE: Cholinesterase, AAG: Alpha-1 Acidic Glycoprotein, NT-proBNP: N-Terminal pro-B-type Natriuretic Peptide, TC: Total cholesterol.)
| Indicators | P | P’ |
|---|---|---|
| CRP | <0.001 | <0.001 |
| SII | <0.001 | 0.003 |
| TC | 0.027 | 0.041 |
| CHE | <0.001 | 0.005 |
| ALB | <0.001 | <0.001 |
| NT-proBNP | 0.043 | 0.830 |
| AAG | 0.032 | 0.294 |
| The regression predictive value | <0.001 | <0.001 |
P’ is the P-value adjusted for age, EP course and body mass index using covariance analysis. (CRP: C-reactive protein, ALB: Albumin, SII: Systemic immuneinflammation index, CHE: Cholinesterase, AAG: Alpha-1 acidic glycoprotein, NT-proBNP: N-terminal pro-B-type natriuretic peptide, TC: total cholesterol.)
A total of 105 cases of EP were included in this retrospective analysis with a total infection rate of 45.3%, The infection rate of EP patients was higher in women compared to men, consistent with results of Zaredar N and Yiu ZZN.3,4
Although previous studies have shown that EP disease itself leads to an increase in inflammatory markers such as CRP,5,6 our study found that their rise indicates EP is complicated with infection, and new best cut-off values for CRP were obtained. We also found that SII, ALB, CHE, TC, AAG, and NT ProBNP may indicate concomitant infection in EP patients, and we explored their comprehensive diagnostic values, sensitivity, specificity, and best cut-off values. Notably, the regression predictive values of CRP, SII, ALB, and TC may be better indicators of infection in EP. However, we conducted a preliminary study with a small to medium-sized sample size, and further verification is needed in the future.
Ethical approval
The research/study was approved by the Institutional Review Board at The Medical Ethics Committee of Xuzhou Medical University Affiliated Hospital, number XYFY2022-KL454-01, dated 2023-01-06.
Declaration of patient consent
The authors certify that they have obtained all appropriate patient consent.
Financial support and sponsorship
Nil.
Conflicts of interest
There are no conflicts of interest.
Use of artificial intelligence (AI)-assisted technology for manuscript preparation
The authors confirm that there was no use of artificial intelligence (AI)-assisted technology for assisting in the writing or editing of the manuscript and no images were manipulated using AI.
Reference
- Updates on the treatment of erythrodermic psoriasis. Psoriasis (Auckland, N.Z.). 2021;11:59-73.
- [CrossRef] [PubMed] [PubMed Central] [Google Scholar]
- Prognosis after hospitalization for erythroderma. Acta Dermato Venereologica. 2016;96:959-62.
- [CrossRef] [PubMed] [Google Scholar]
- Infections in hospitalized patients with psoriasis in a skin referral hospital. Dermatol Pract Concept. 2023;13:e202302.
- [CrossRef] [PubMed] [PubMed Central] [Google Scholar]
- Development and validation of a multivariable risk prediction model for serious infection in patients with psoriasis receiving systemic therapy. Br J Dermatol. 2019;180:894-901.
- [CrossRef] [PubMed] [PubMed Central] [Google Scholar]
- C-reactive protein, chemerin, fetuin-A and osteopontin as predictors of cardiovascular risks in persons with psoriasis vulgaris. Physiol Res. 2021;70:383-91.
- [CrossRef] [PubMed] [PubMed Central] [Google Scholar]
- Pathophysiology of generalized pustular psoriasis. Exp Dermatol. 2023;32:1194-203.
- [CrossRef] [PubMed] [PubMed Central] [Google Scholar]