Translate this page into:
A portable fluorescence spectrometer as a noninvasive diagnostic tool in dermatology: A cross-sectional observational study
2 REDX WeSchool, Prin. L. N. Welingkar Institute of Management Development and Research, Mumbai, Maharashtra, India
3 Camera Culture, MIT Media Lab, Massachusetts Institute of Technology, Massachusetts, USA
Correspondence Address:
Shital Poojary
B405, Bhoomi Residency, Mahavir Nagar, Kandivali West, Mumbai - 400 067, Maharashtra
India
| How to cite this article: Poojary S, Jaiswal S, Wahi A, Sahoo A, Shah F, Rathod G, Das AJ. A portable fluorescence spectrometer as a noninvasive diagnostic tool in dermatology: A cross-sectional observational study. Indian J Dermatol Venereol Leprol 2019;85:641-647 |
Sir,
Fluorescence spectroscopy techniques involve emission of waves of fluorescence spectra by the fluorophores (flavin adenine dinucleotide [FAD], reduced form of nicotinamide adenine dinucleotide [NAD], etc.) within the skin, as a result of absorption of specific excitation wavelengths of light.[1] On the other hand, chromophores such as melanin and hemoglobin in the skin absorb certain range of wavelengths from the light incident on them [Table - 1].[2]
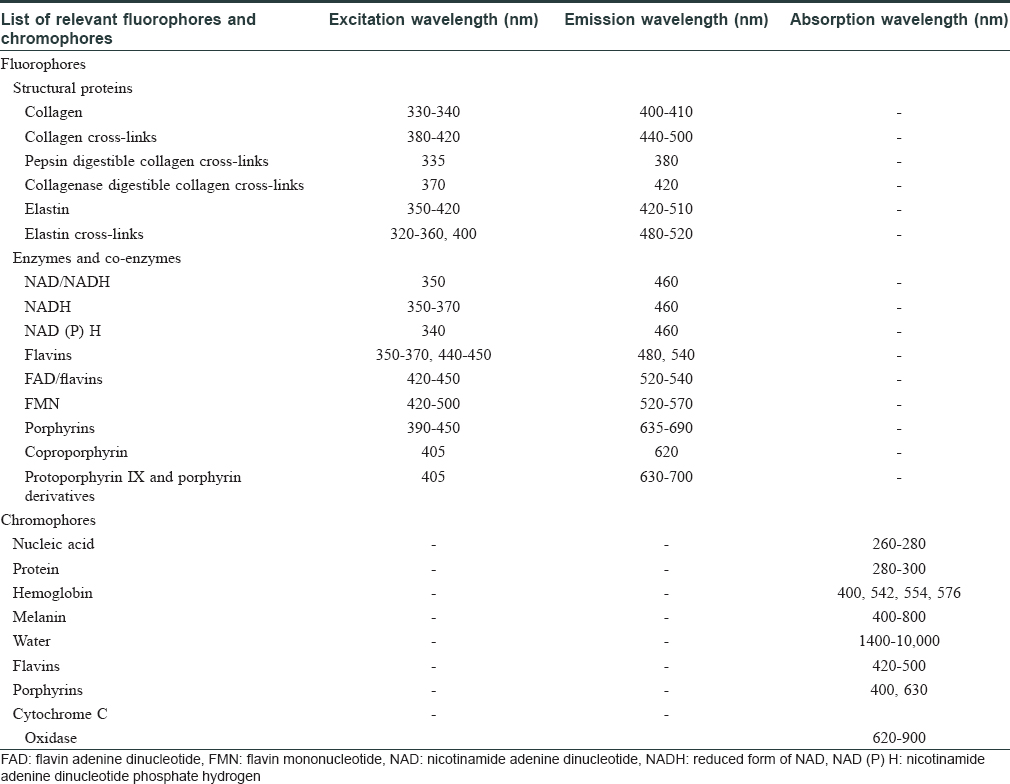
Different skin conditions result in varying concentrations and distribution of fluorophores and chromophores in the skin, thus generating distinct spectra under certain excitation conditions.[3] [Figure - 1] shows the interaction of ultraviolet (UV)-A light with the skin.
 |
| Figure 1: The mechanism of fluorescence of skin: (a) incident light, (b) reflected light, (c) Ttransmitted/refracted light, (d) fluorescent light absorbed by melanin, and (e) unabsorbed fluorescent light emitted |
A prospective cross-sectional observational study was designed to obtain and correlate different fluorescence spectra with corresponding clinical diagnoses and to determine distinguishing quantitative parameters of fluorescence spectra to differentiate closely resembling skin conditions (e.g. vitiligo vs. non-vitiligo hypopigmented conditions). It was conducted using a specially designed smartphone-enabled portable fluorescence spectrometer, developed by an innovation laboratory over 6 months, in the Department of Dermatology, K. J. Somaiya Medical College and Research Centre, Mumbai.
A total of 260 patients of any age/gender, with confirmed clinical diagnosis, were included in the study after written informed consent. Patients with erosions/ulcerations/oozing or any infectious skin diseases were excluded. The device used was a portable handheld spectrometer along with its companion mobile application [Figure - 2]. The spectrometer had a UV-A light-emitting diode light source of spectral range 360–460 nm and a mini-spectrometer of spectral range 340–750 nm to capture the emitted light from the skin.
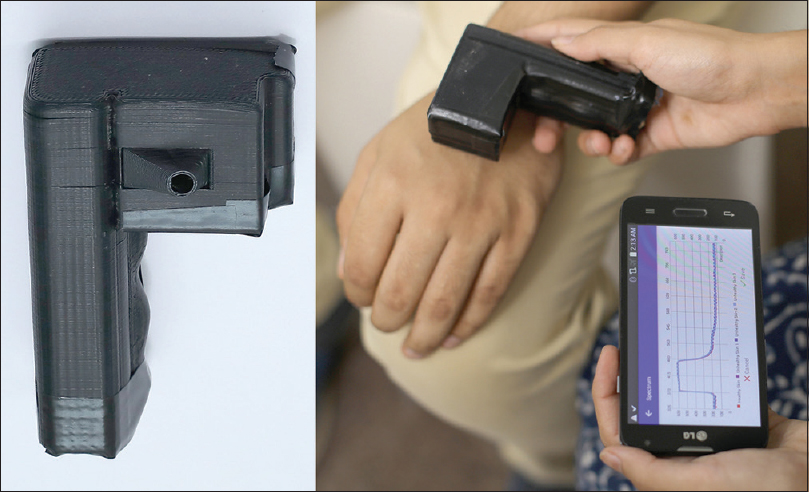 |
| Figure 2: Use of fluorescence spectrometer in capturing fluorescence spectra and transfer via Bluetooth to mobile phone |
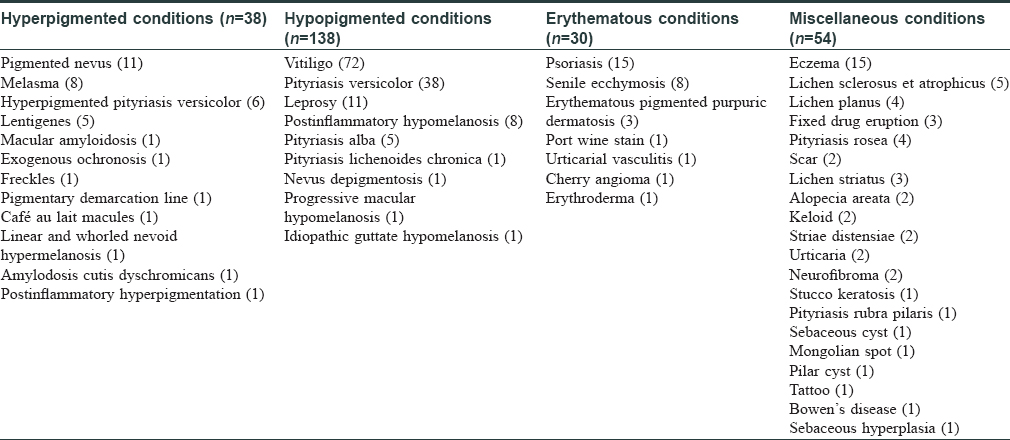
The spectral readings were captured from both the lesional (test) and contralateral healthy (control) skin of the patient [Figure - 3]a, [Figure - 3]b. Three consecutive fluorescence readings were taken from the lesional area and then averaged in MATLAB software [Figure - 3]c. Data generated were further analyzed by discriminant analysis. Spectral data were segregated as hyperpigmented (38), hypopigmented (138), erythematous (30), and miscellaneous conditions (54) [Table - 2].
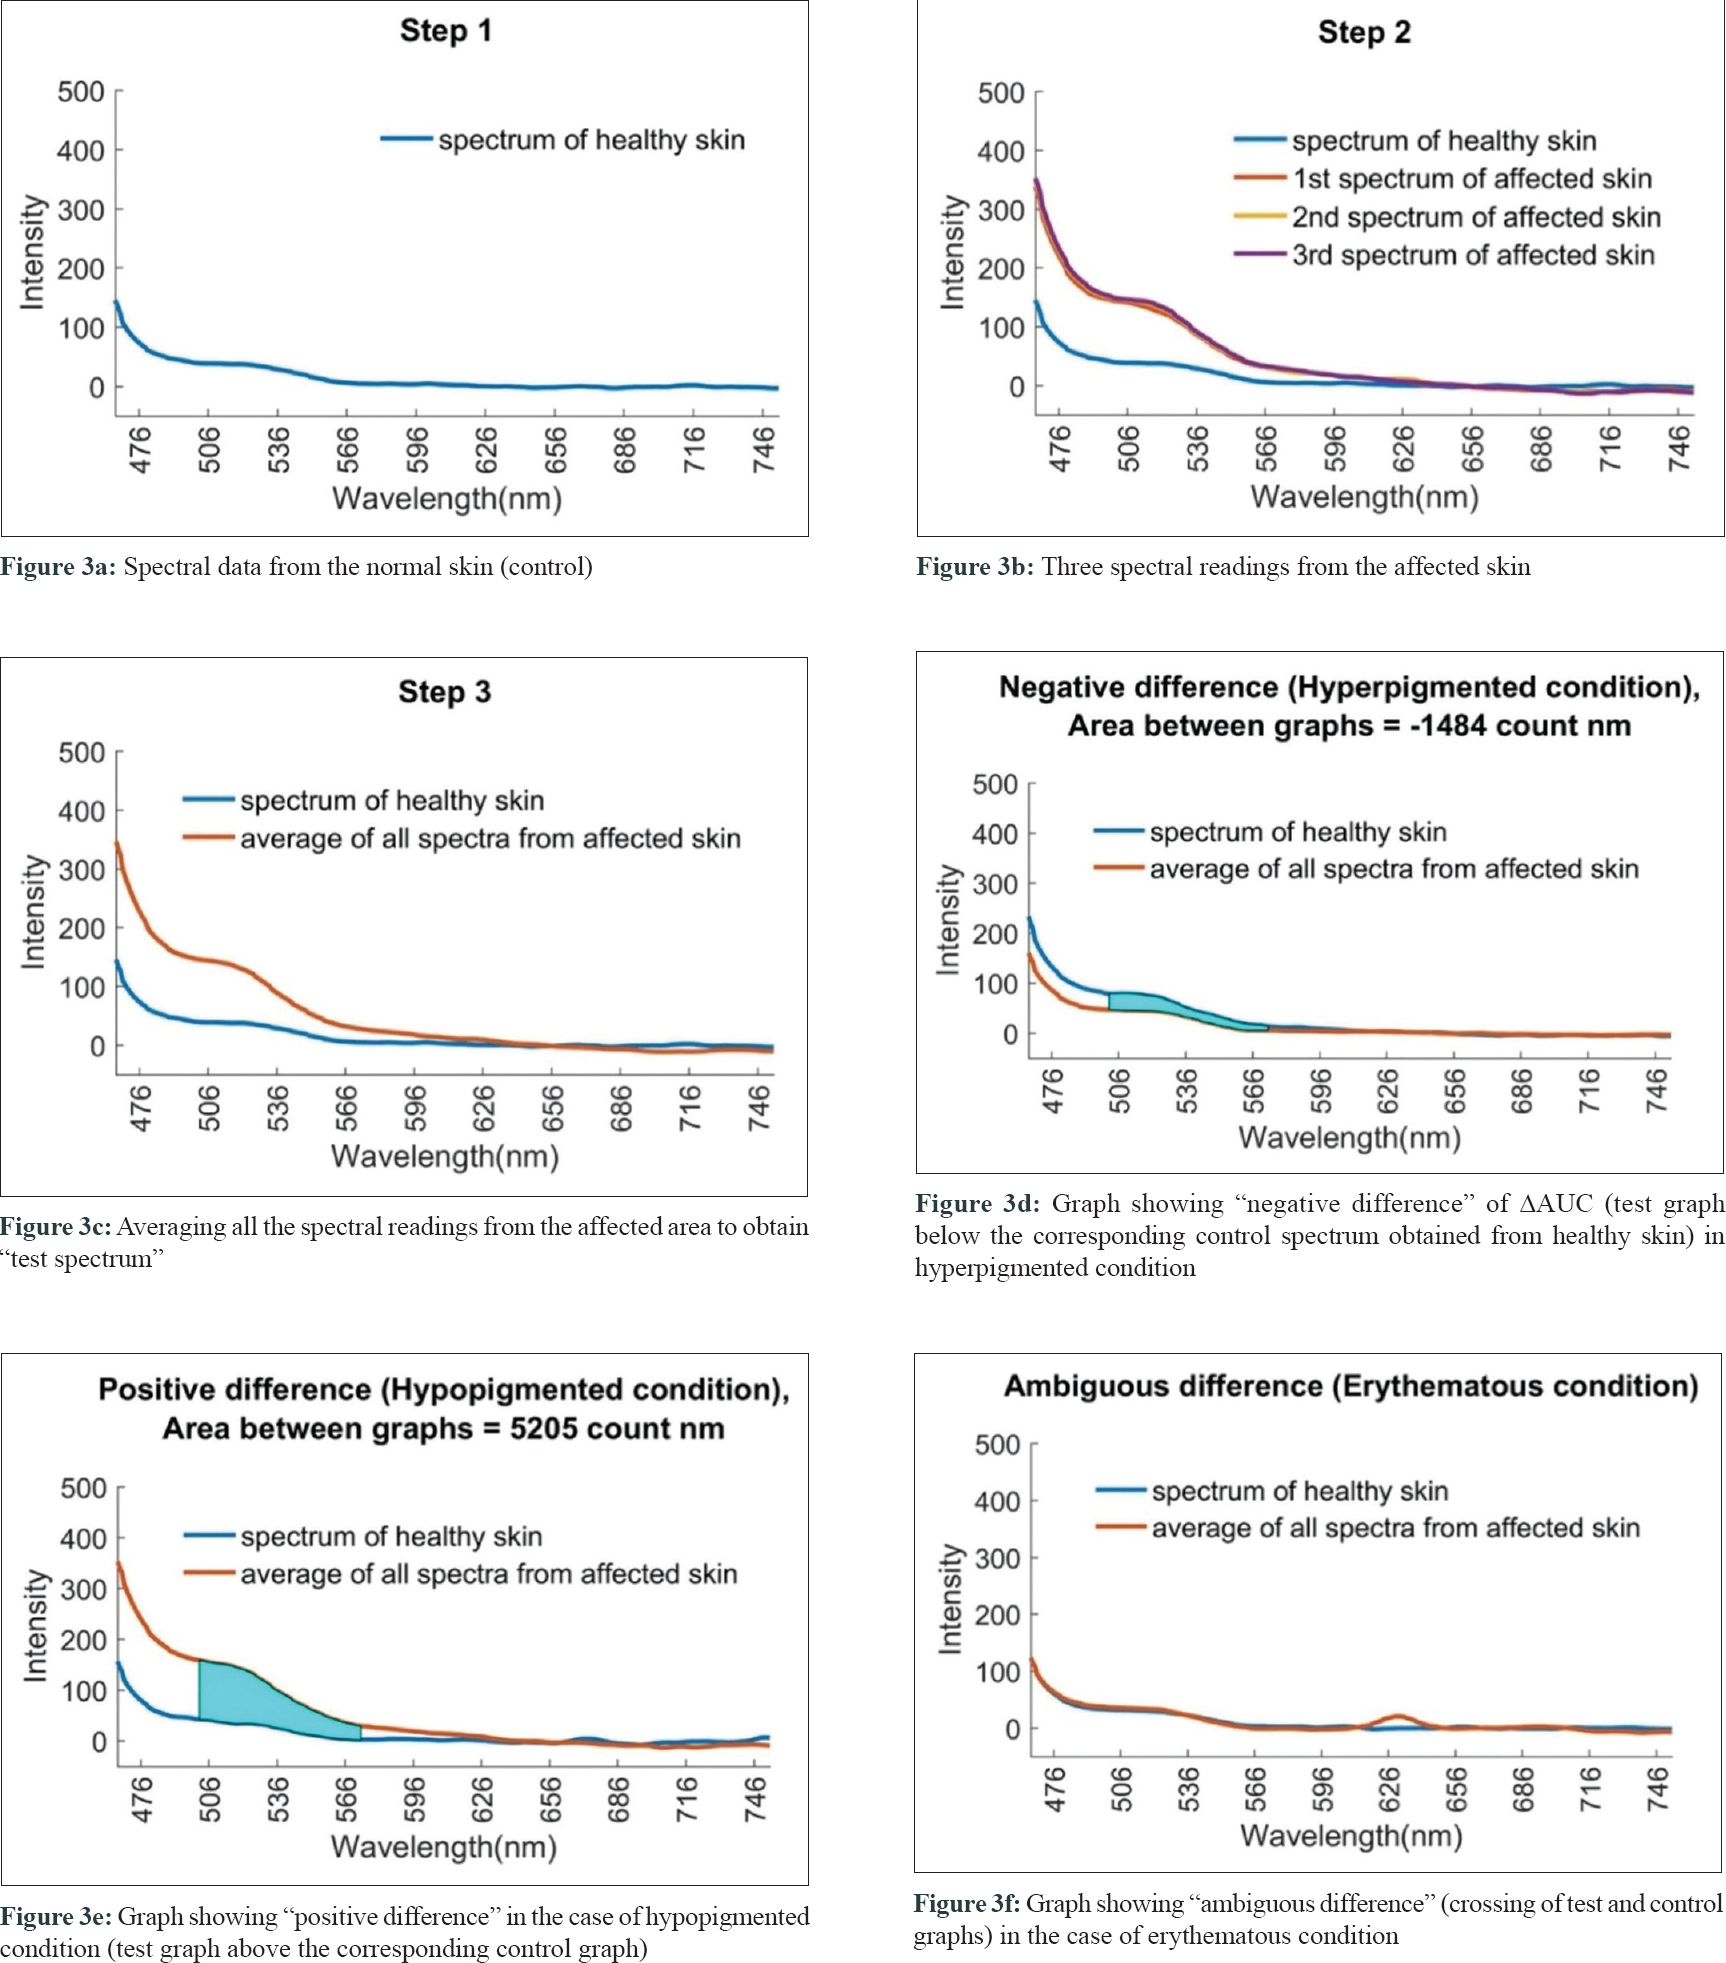 |
| Figure 3: |
Most of the fluorophores such as collagen cross-links, elastin, elastin cross-links, flavins, FAD, and flavin mononucleotide (FMN) show emission at a wavelength range of 502–573 nm, while chromophores such as melanin can also absorb wavelengths in the same spectrum. Hence, spectral analysis was done on emission spectra in the wavelength range of 502–573 nm.
Further analysis was done on spectral data from hypopigmented disorders (n = 138) to determine a quantitative spectral cut-off value for distinguishing vitiligo (n = 72) from other hypopigmented disorders (n = 66). Although the range of 502–573 nm comes under visible light spectrum, we aimed at quantified analysis of the emitted spectrum from hypopigmented skin lesions to determine a quantitative cut-off spectral value for the diagnosis of vitiligo.
Difference in area under curve (△AUC) was calculated for vitiligo and non-vitiligo patients and subjected to statistical analysis using SPSS version 2.0. Receiver operating characteristic (ROC) curve was plotted for the predictor variable (area difference) to determine the critical point (cut-off) to detect vitiligo. Data was also collected at the follow-up visit of six patients with vitiligo to observe and possibly explore the use of our device for predicting prognosis of skin conditions.
Negative difference in spectral graphs was observed in 25 of the 38 cases with hyperpigmented conditions and in 19 of 30 cases with erythematous conditions. Negative difference spectra were almost evenly distributed among diseases other than hypopigmented disorders with no distinctive differences across diseases [Table - 3] and [Figure - 3]d.

Positive difference in spectral graphs was observed in 103 of 136 cases of hypopigmented lesions when compared with normal reference graphs [Table - 3] and [Figure - 3]e. Thus, consistent alteration in spectral data was observed in hypopigmented conditions in spectra generated from our device.
Ambiguous spectra, that is, crossing of test and control spectra, were seen in 50 patients [Table - 3] and [Figure - 3]f.
The sensitivity and specificity of the device in detecting each group of disorders are as follows:
- Hypopigmented conditions: 74.6% and 73%, respectively
- Hyperpigmented conditions: 65.8% and 77.9%, respectively
- Erythematous conditions: 63.3% and 76.1%, respectively
Within the subset of hypopigmented conditions, the fluorescence in the range of 502–573 nm was markedly increased in vitiligo when compared with other hypopigmented conditions. The mean changes observed in spectra, that is, △AUC were as follows: (1) vitiligo: +2913.70, (2) pityriasis versicolor: +268.68, (3) leprosy: −0.93, (4) postinflammatory hypopigmentation: +220.82, (5) pityriasis alba: +105.06, (6) Idiopathic guttate hypomelanosis: +10.10, (7) progressive macular hypomelanosis: +467.55, (8) nevus depigmentosus: −250.04, and (9) pityriasis lichenoides chronica: −84.84 [Figure - 4].
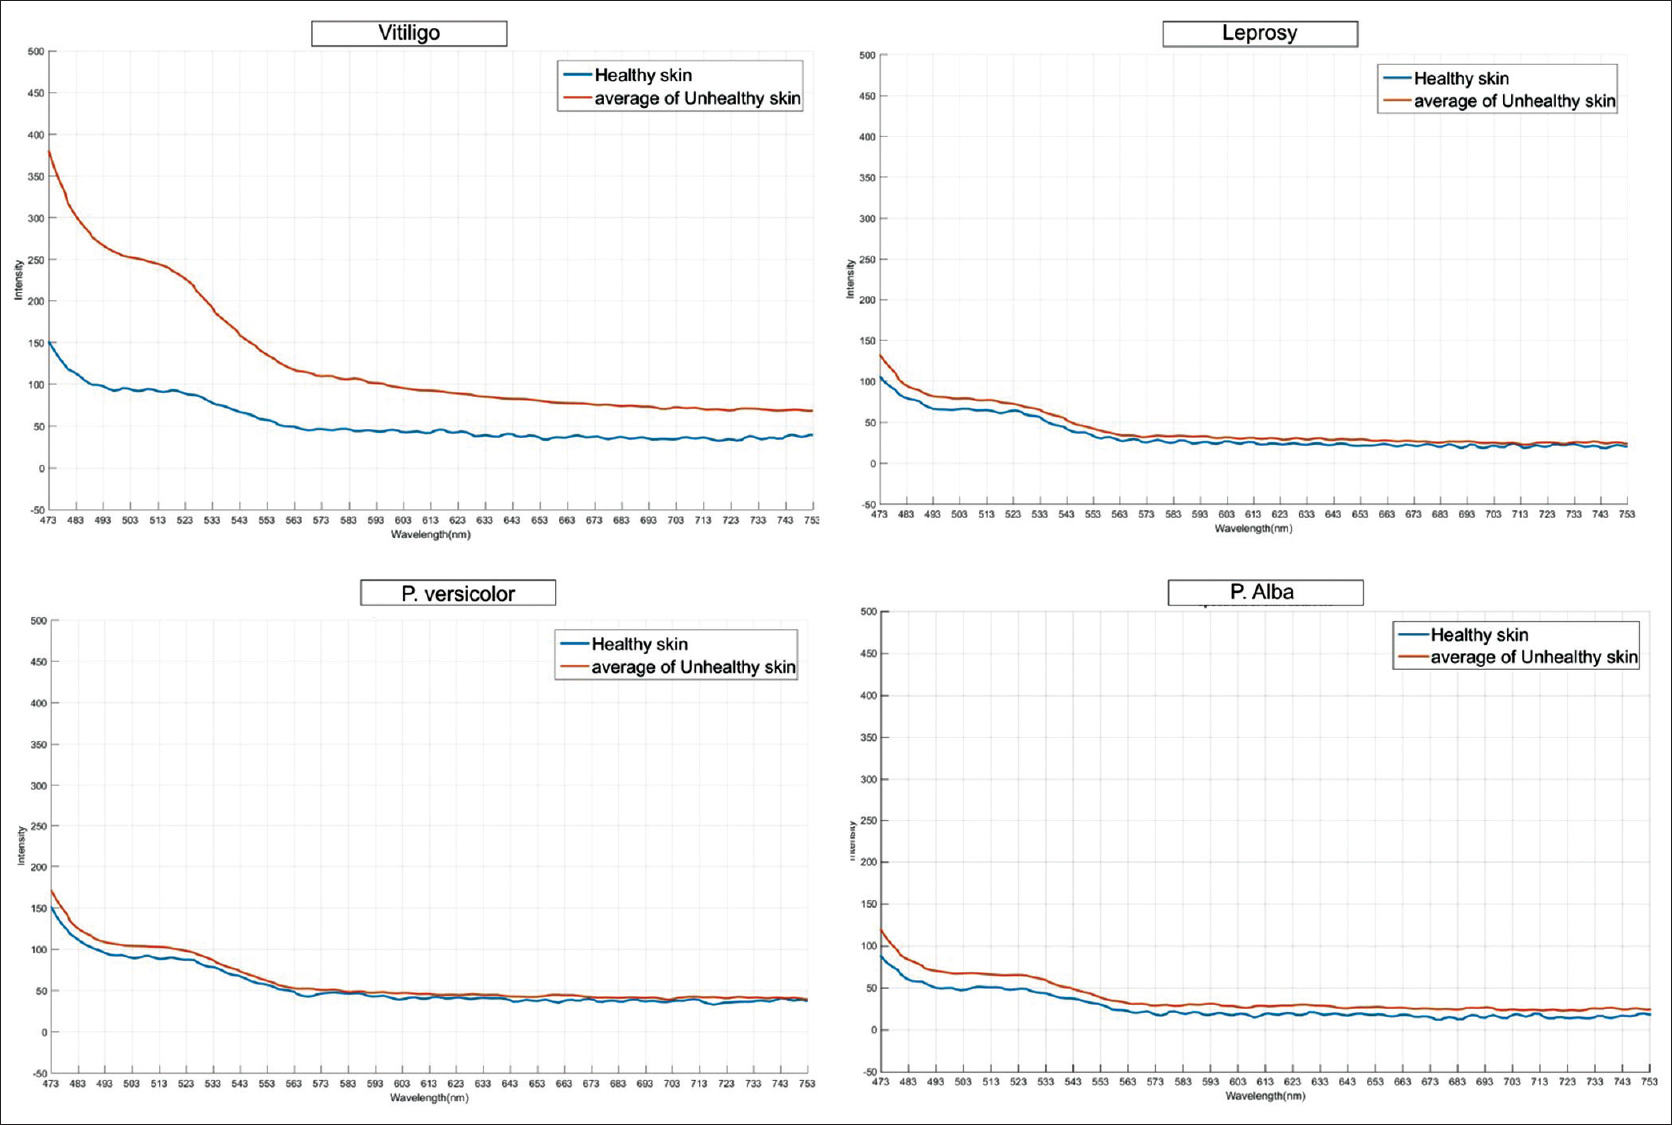 |
| Figure 4: Representative fluorescence spectra of vitiligo and other hypopigmented diseases (leprosy, pityriasis versicolor, and pityriasis alba) |
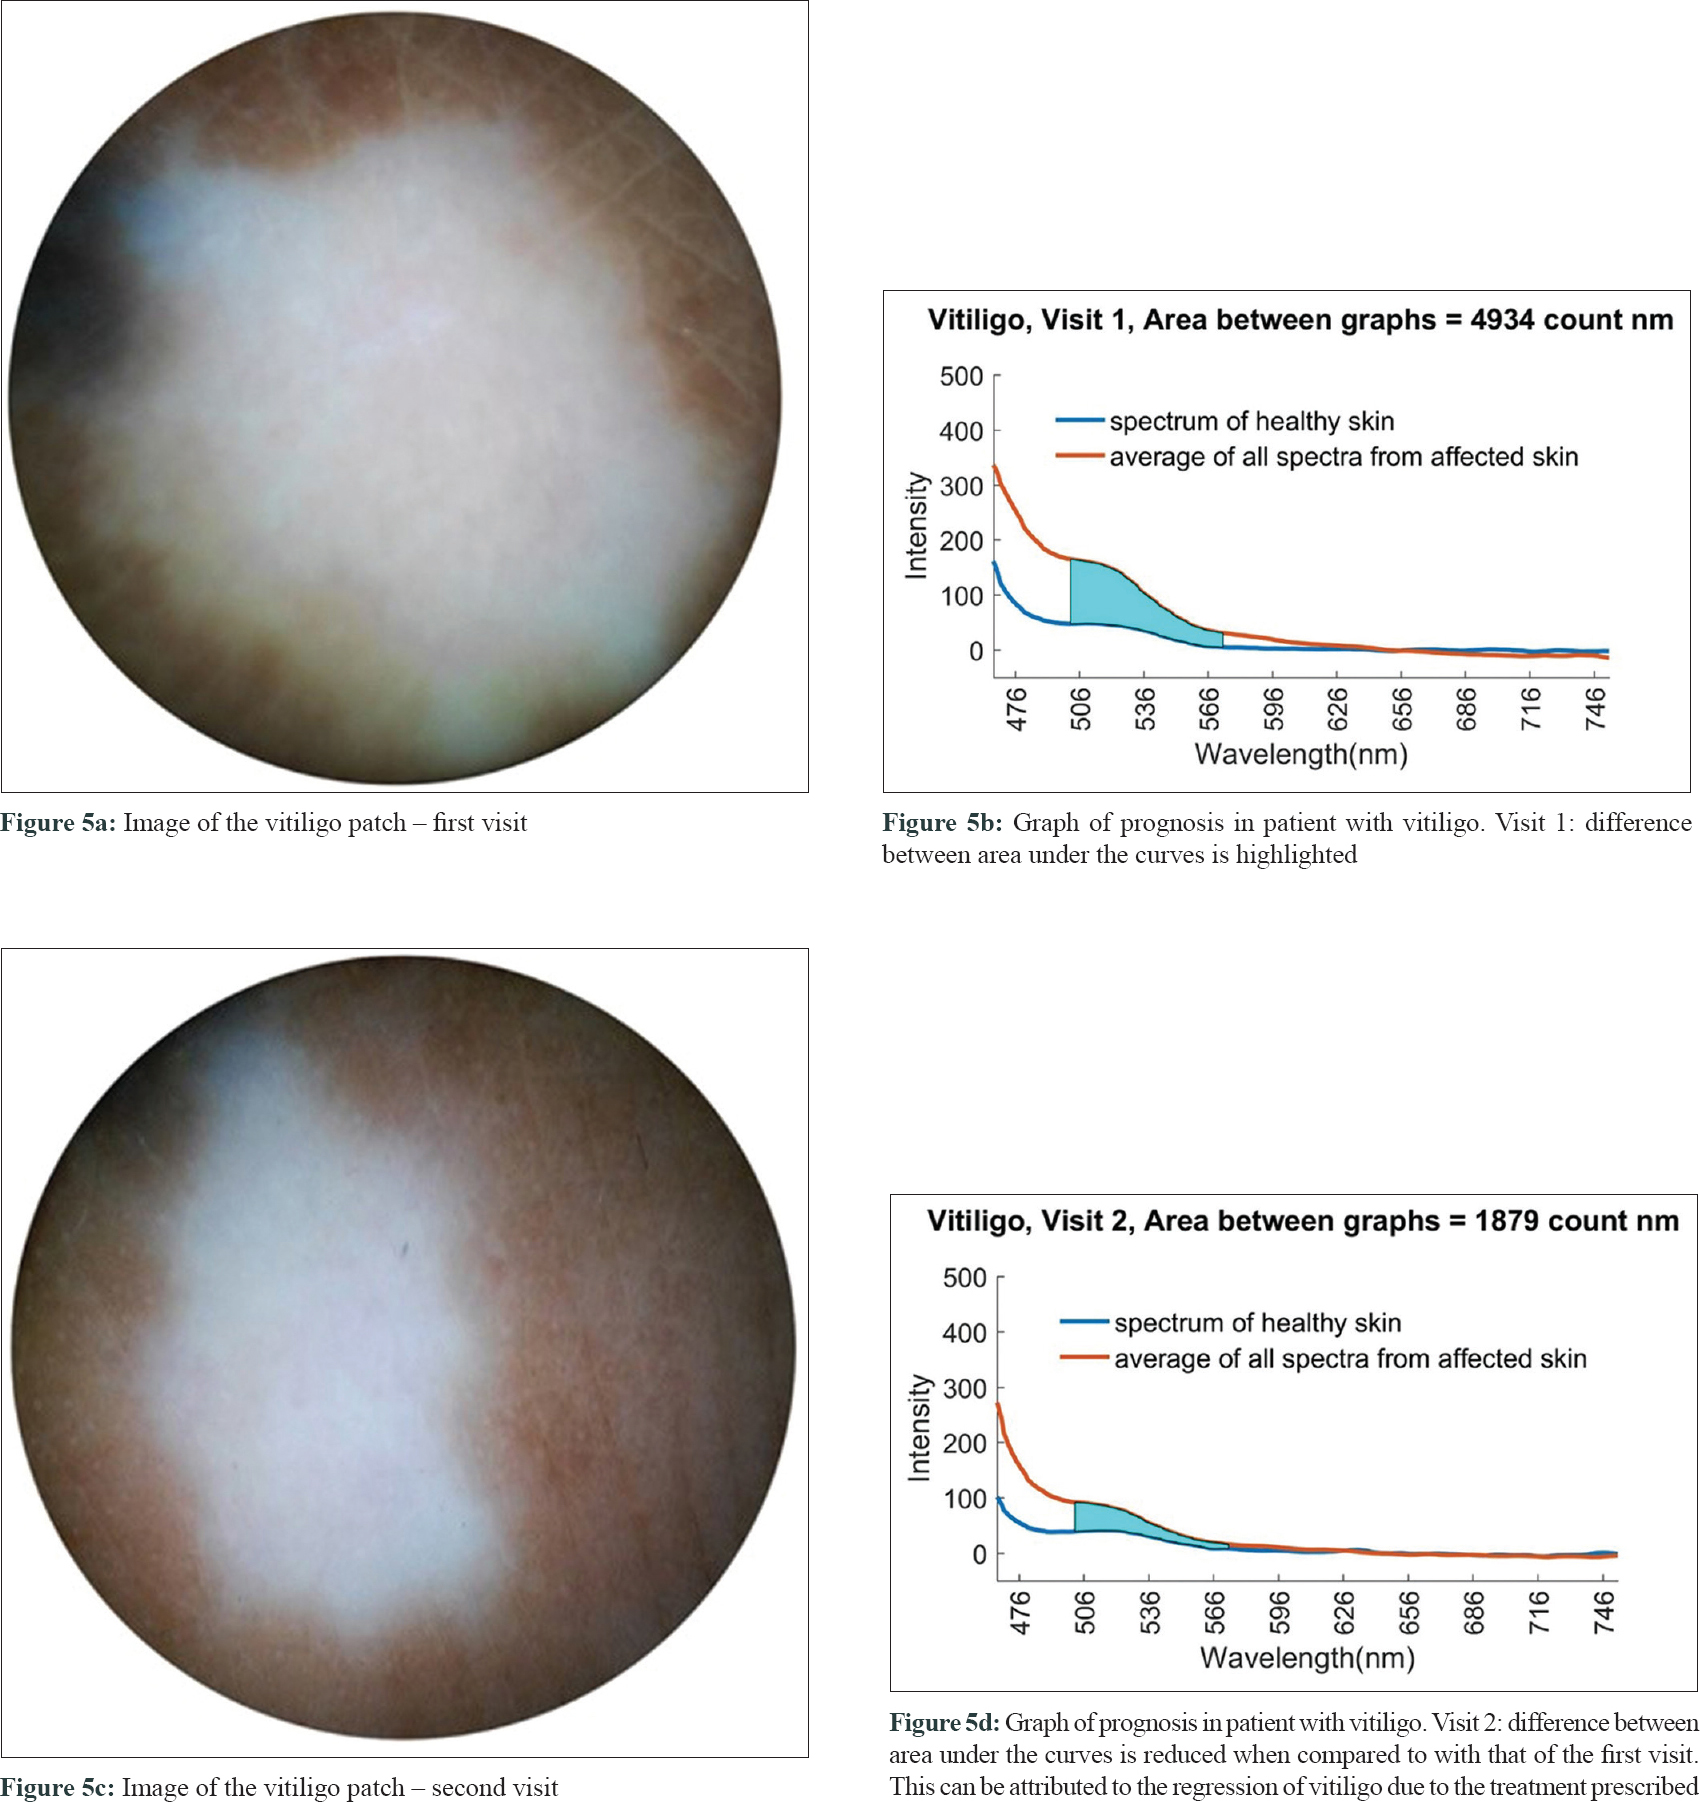
The critical point (cut-off) to differentiate vitiligo from other hypopigmented disorders using area difference (△AUC) was 975.995 counts nm (Chi-square test on ROC curves; P < 0.0001) with a sensitivity of 93.1% and specificity of 86.4%. Two of the six patients with vitiligo whose follow-up spectra were examined showed a reduction in area under their respective spectral curves (△AUC) as shown in [Figure - 5].
 |
| Figure 5: |
Previous studies on the use of fluorescence spectroscopy in dermatology have suggested that spectroscopy can be a useful, noninvasive method for rapid diagnosis of skin conditions.[4],[5]
A positive difference in the fluorescence spectra from the affected skin can be due to either increase in the amount of fluorophores (e.g. biopterin) or decrease in the amount/absence of major chromophores/absorbers (e.g. melanin).
Similarly, a negative difference in spectra obtained from affected skin can be attributed to increased melanin in hyperpigmented conditions (e.g. lentigines) and hemoglobin in erythematous conditions (e.g. port wine stain).
In our study, a consistent alteration in spectral data was observed between the wavelengths of 502 and 573 nm in hypopigmented conditions (positive difference). The increase in fluorescence in vitiligo can be explained by fluorescence from accumulation of two oxidized pteridines (6-biopterin, 7-biopterin) and reduction in the amount/absence of melanin, because of which the fluorescence spectra were not absorbed, unlike in normal skin.
A similar case report of fluorescence spectroscopy in a patient with vitiligo showed peak fluorescence between 500 and 550 nm.[4] Lack of distinct differences in peak fluorescence in other hypopigmented conditions might probably be explained by the multifactorial etiology of and varied fluorophores and chromophores in hypopigmentation in leprosy, pityriasis alba, pityriasis versicolor, postinflammatory hypopigmentation, progressive macular hypomelanosis and so on.
The threshold value of △AUC between spectra obtained from healthy and affected vitiliginous skin in the study (975.995 counts nm) can be recommended to screen vitiligo using our portable fluorescence spectrometer with 93.1% sensitivity and 86.4% specificity.
Hence, in our study, we found the device to be specifically helpful in differentiating vitiligo objectively and quantitatively from non-vitiligo hypopigmented conditions. This noninvasive, affordable device could be very useful for the rapid diagnosis of vitiligo in rural/semi-urban areas in India, where social stigma against vitiligo is high especially in the setting of nonavailability of a dermatologist.
Since it is a quantitative differentiation, it would be useful to differentiate even previtiligo cases from other cause of hypopigmentation. However, this would require validation by a study comparing only previtiligo cases with other hypopigmented conditions.
Another potential use of this device could be to assess the prognosis of vitiligo as mentioned above [Figure - 5]. The reduction in area under the curve observed in two patients can be a quantitative parameter to monitor the efficacy of treatment, also in vitiligo. However, precise mapping of the lesion would be required while capturing spectra for assessment. A larger sample size would be required to validate these preliminary results and prove the efficacy of our device in prognostic studies of vitiligo. A detailed study would be required to confirm these preliminary findings.
Acknowledgments
The authors would like to thank Dr. Uday Salunkhe (Group Director), of Prin. L. N. Welingkar Institute of Management Development and Research (WeSchool), and other faculty members for support, encouragement, and guidance. They are grateful to the Tata Trusts for providing partial funding for development of the spectrometer at REDX Innovation Lab. They would like to thank Prof. Ramesh Raskar, Head of Camera Culture Group, MIT Media Lab, for providing them the mentorship to work on this project. They would also like to thank Dr. Vinayak Sabnis (Dean) and Rohit Pandharkar (laboratory mentor) for their support and feedback. They thank Dr. Dipak Patil, Assistant Professor, Department of Community Medicine, K. J. Somaiya Medical College and Research Centre, for helping in statistical analysis. They thank Ishan Kothari for his contributions toward making the mobile application and Sonali Patel for her illustrations of skin diagram.
Declaration of patient consent
The authors certify that they have obtained all appropriate patient consent forms. In the form the patients have given their consent for their images and other clinical information to be reported in the journal. The patients understand that their names and initials will not be published and due efforts will be made to conceal their identity, but anonymity cannot be guaranteed.
Financial support and sponsorship
Tata Trusts and REDX WeSchool, Prin. L. N. Welingkar Institute of Management Development and Research, Mumbai, India.
Conflicts of interest
There are no conflicts of interest.
| 1. |
Ramanujam N. Fluorescence spectroscopy of neoplastic and non-neoplastic tissues. Neoplasia 2000;2:89-117.
[Google Scholar]
|
| 2. |
Young AR. Chromophores in human skin. Phys Med Biol 1997;42:789-802.
[Google Scholar]
|
| 3. |
Hamblin MR, Avci P, Gupta GK. Imaging in Dermatology. London: Elsevier; 2016. p. 142.
[Google Scholar]
|
| 4. |
Hamzavi I, Shiff N, Martinka M, Huang Z, McLean D, Zeng H, et al. Spectroscopic assessment of dermal melanin using blue vitiligo as an in vivo model. Photodermatol Photoimmunol Photomed 2006;22:46-51.
[Google Scholar]
|
| 5. |
Gillies R, Zonios G, Anderson RR, Kollias N. Fluorescence excitation spectroscopy provides information about human skin in vivo. J Invest Dermatol 2000;115:704-7.
[Google Scholar]
|
Fulltext Views
3,740
PDF downloads
1,645


