Translate this page into:
ATP2C1 knockdown induces abnormal expressions of cytoskeletal and tight junction proteins mimicking Hailey–Hailey disease
Corresponding author: Dr. Wenwen Chen, Department of Dermatology, Yangling Demonstration Zone Hospital, Yangling, China. 15736875920@163.com
-
Received: ,
Accepted: ,
How to cite this article: Zhou M, Kang S, Xia Y, Zhang D, Chen W. ATP2C1 knockdown induces abnormal expressions of cytoskeletal and tight junction proteins mimicking Hailey–Hailey disease. Indian J Dermatol Venereol Leprol. 2024;90:722-30. doi: 10.25259/IJDVL_853_2023
Abstract
Background
Hailey–Hailey disease (HHD) is a rare, autosomal dominant, hereditary skin disorder characterised by epidermal acantholysis. The HHD-associated gene ATPase calcium-transporting type 2C member 1 (ATP2C1) encodes the protein secretory pathway Ca2+ ATPase1 (SPCA1), playing a critical role in HHD pathogenesis.
Aims
We aimed to investigate the effect of ATP2C1 knockdown on keratinocytes that mimicked acantholysis in HHD.
Methods
Immunohistochemistry (IHC) was employed to evaluate the levels of cytoskeletal and tight junction proteins such as SPCA1, P-cofilin, F-actin, claudins, occludin, and zonula occludens 1 in the skin biopsies of patients with HHD. Subsequently, the expression of these proteins in cultured ATP2C1 knockdown keratinocytes was analysed using Western blotting and immunofluorescence. Furthermore, we assessed the proliferation, apoptosis, and intracellular Ca2+ concentrations in the ATP2C1-knocked keratinocytes.
Results
The results showed decreased levels of these proteins (SPCA1, P-cofilin, F-actin, claudins, occluding, and zonula occludens 1) in HHD skin lesions. Moreover, their levels decreased in human keratinocytes transfected with ATP2C1 short hairpin RNA, accompanied by morphological acantholysis. Furthermore, the proliferation and apoptosis of the keratinocytes, as well as intracellular calcium concentrations in these cells, were not affected.
Limitations
The limitations of this study are the absence of animal experiments and the failure to explore the relationship between skeletal and tight junction proteins.
Conclusion
The present study indicated that ATP2C1 inhibition led to abnormal levels of the cytoskeletal and tight junction proteins in the keratinocytes. Therefore, keratinocytes can mimic HHD-like acantholysis and serve as an in vitro model, helping develop treatment strategies against HHD.
Keywords
ATP2C1
F-actin
Hailey–Hailey disease
P-cofilin
SPCA1

Introduction
Hailey–Hailey disease (HHD) or familial benign chronic pemphigus, an uncommon, autosomal dominant genodermatosis with complete penetrance is characterised by flaccid vesicles and blisters, with a predilection for intertriginous regions, such as the retroauricular folds, axillae, lateral aspects of the neck, and inguinal and perianal regions.1 A genetic defect in the Adenosine Triphosphatase (ATP) calcium-transporting type 2C member 1 gene (ATP2C1) located on chromosome 3q21-q24 causes this disease.2 ATP2C1 encodes a protein named human secretory pathway Ca2+/Mn2+-ATPase pump type 1 (SPCA1), which is present in the Golgi apparatus membrane and plays a role in Ca2+/Mn2+ transportation, maintaining a balance between Ca2+ concentration in the cytoplasm and Golgi apparatus.3 A hereditary mutation in ATP2C1 results in insufficient SPCA1 levels, leading to a reduction in Ca2+/Mn2+ concentrations in the Golgi apparatus. This alteration disrupts the functions of Golgi apparatus proteins that depend on normal Ca2+ levels, causing abnormalities in intercellular connections in keratinocytes and ultimately leading to desquamation in the skin epidermis.
Despite knowing that ATP2C1 mutations are the primary cause of HHD, the precise molecular mechanism of the gene in HHD has not been elucidated. The widespread desquamation of spinous-layer cells in HHD is probably associated with the levels of tight junction proteins and desmosomes. In a study, an in vitro cell model was established by ATP2C1 transfection, and its knockdown showed that the levels of desmosomes remained unchanged. In contrast, the levels of the tight junction protein claudin increased, and those of zonula occludens protein 1 (ZO-1) decreased.4 Therefore, we shifted our focus from desmosomes to exploring the link between HHD and tight junction proteins. ZO-1 directly interacts with occludin, claudin 1, and claudin 4 via the post-synaptic density disc large Zo-1 domains. In contrast, its C-terminus directly binds to F-actin to interact with the F-actin cytoskeleton.5,6 The actin-severing protein cofilin binds to the phosphorylated region of SPCA1. It gets phosphorylated to form P-cofilin, which, in turn, interacts with F-actin, resulting in SPCA1 activation and Ca2+ and Mn2+ pumping into the Golgi apparatus lumen under adequate ATP supply.7 Moreover, epithelial cells participate in cell adhesion and tight junction protein connections with the help of Ca2+ and F-actin polymerisation.8 Therefore, we hypothesised an association between HHD occurrence and P-cofilin and F-actin levels.
Moreover, we performed this study to evaluate the relationship between the levels of SPCA1 and cytoskeletal or tight junction proteins in HHD skin lesions. Furthermore, the effect of ATP2C1 knockdown on these protein levels and morphological acantholysis was analysed using keratinocytes.
Materials and Methods
Human tissue samples
HHD skin samples were obtained from patients (n = 22) with HHD after examining their clinical features and histopathology. Normal skin tissues were collected from healthy donors (n = 20) undergoing plastic surgery. For keratinocyte experiments, human foreskin tissues were isolated from healthy patients who underwent circumcision. This study was performed under the guidance and supervision of the Hospital Research Ethics Committee, and written informed consent was obtained from all subjects.
Immunohistochemistry (IHC)
As described previously,9 tissues were cut into 5-mm paraffin sections. The sections were subjected to dewaxing treatment, followed by antigen retrieval with sodium citrate. After incubation with 2% goat serum (Beyotime Biotech, Shanghai, China), the samples were incubated with primary antibodies at 4℃ overnight. These primary antibodies were mouse antibodies against SPCA1 (Proteintech, Rosemont, Illinois, USA), F-actin (Abcam, Cambridge, MA, USA) and rabbit antibodies against glyceraldehyde-3-phosphate dehydrogenase (GAPDH; Proteintech), occludin (Abcam), claudin 1 (Abcam), claudin 4 (Abcam), ZO-1 (Abcam), and P-cofilin (Cell Signaling Technology, Danvers, MA, USA). Then, the sections were incubated with a horseradish peroxidase-labelled goat anti-Rabbit/Mouse antibody (DAKO, Glostrup, Denmark) and the 3, 3’-diaminobenzidine chromogen substrate (DAKO). Phosphate-buffered saline controls were used for all samples.
Cell culture and short hairpin RNA (shRNA) transfection
Keratinocytes were obtained as described previously,10 and cultured in the keratinocyte serum-free medium (KFSM) with low Ca2+ (0.09 mM; KSFM; Sciencell, San Diego, CA, USA). The cultured cells at passage 2 or 3 were divided into blank, control shRNA, and ATP2C1 shRNA lentivirus transfection groups and seeded on 6-well plates. A total of 20 µl of shRNA lentivirus (5×10 7 TU/mL) and enhancement solutions (Genechem, Shanghai, China) were added to the culture medium of the ATP2C1 shRNA group. The exact amounts of the harmful virus and enhancement solution were added to the control shRNA group. After 8 h of transfection, the medium was replaced with regular KSFM. After culturing for 72 h, the keratinocytes were further cultured in the KSFM containing 1 µg/mL puromycin for cell selection. When the blank-group cells were completely killed by puromycin, and no more cells died in the ATP2C1 shRNA group, the surviving cells were used for further experiments.
Quantitative reverse transcriptase polymerase chain reaction (qRT-PCR)
Total RNA was extracted from fresh tissues and cell cultures using the Trizol reagent (Invitrogen, Carlsbad, CA, USA). RNA was reverse transcribed into complementary DNA (cDNA) using a commercial cDNA kit (Takara Bio, Shiga, Japan). Then, qPCR was performed on a 7900HT Fast PCR System (Applied Biosystems, Waltham, MA, USA). SYBR Green Master Mix (Takara Bio, Shiga, Japan) was a fluorescent dye. The synthesis of all target gene primers was performed by Bioscience (Shanghai, China) using GAPDH primers as internal references. The primer sequences are listed in Supplementary Table 1.
Cellular immunofluorescence
The cells were cultured in glass-bottom culture dishes (MatTek, Ashland, MA, USA) and fixed with the 4% paraformaldehyde (PFA) solution. The cells were permeabilised using Triton and subsequently blocked using a goat serum. Then, the cells were incubated with primary antibodies (see above under (IHC)) at 4°C overnight. Subsequently, AL488-labelled goat anti-rabbit/mouse IgG (Beyotime, Shanghai, China) was added for staining. After incubating with the 4¢,6-diamidino-2-phenylindole (DAPI) solution (Het Biotech, Xi’an, China), the cells were observed under a digital confocal microscope (Leica, Wetzlar, Germany).
Western blotting technique
Protein lysates were prepared from the cell cultures using the radioimmunoprecipitation buffer (Het Biotech). Protein concentrations were determined using the Bicinchoninic Acid Protein Assay Kit (Het Biotech). The samples were separated on electrophoresis gels, followed by transfer onto polyvinylidene difluoride membranes (Millipore, Burlington, MA, USA). Horseradish peroxidase goat anti-rabbit/mouse immunoglobulin G (1 µg/ml; Abcam) was used as a secondary antibody. Then, an electrochemiluminescence kit (Millipore) was used for signal detection. The intensities of all protein bands were compared with the intensities of Glyceraldehyde-3-phosphate dehydrogenase (GAPDH) bands of the same filter. The obtained band intensities were quantified using the ImageJ software (National Institutes of Health, Bethesda, MD, USA).
Transmission electron microscopy (TEM)
The cells were fixed using the electron-microscopy-specific fixative, followed by neutral phosphate buffer-osmic acid addition. After dehydration and embedding, the cells were cut into 60–80 nm ultra-thin sections. Following double staining with 1% uranyl acetate and lead citrate, the sections were visualised, and images were captured with a transmission electron microscope (HT7700, HITACHI, Tokyo, Japan).
Cell proliferation and apoptosis
The cells were cultured in 96-well plates and transfected with shRNA. After transfecting for 24, 48, and 72 h, the cultures were analysed for cell proliferation. The cell counting kit-8 (CCK-8) solution (Beyotime) was added, and the cells were incubated at 37°C for 2 h. Absorbance was measured at 450 nm.
Cell apoptosis was determined using flow cytometry. After 48 h of transfection, the cells were diluted to 1 × 10⁶ cells/mL, incubated with a binding buffer, and mixed with 7-amino actinomycin D (7-AAD) (red fluorescence) and annexin V-phycoerythrin (orange-red fluorescence). The data were analysed using the LSRII instrument (BD Biosciences, San Jose, CA, USA) and processed using the FlowJo7.6.1 software (BD, San Diego, CA, USA).
Intracellular Ca2+ detection
The cells in the three groups were transferred to black 96-well plates and cultured for 24 h. The culture medium was then replaced with an assay buffer containing fluo-3 AM (0.5 µM, Beyotime), and the cells were further incubated at 37°C for 60 min for fluorescence probe loading.11 Intracellular fluo-3 fluorescence was then monitored at an excitation wavelength of 506 nm and an emission wavelength of 526 nm using a fluorescent enzyme labelling instrument (Labsystems Multiskan MS, Finland). Relative fluorescence values compared the intracellular Ca2+AQ concentration of the three groups.
Statistical analysis
The experimental results were subjected to statistical analysis and graphing using the ImageJ and GraphPad Prism 8.0 software. A two-sample independent t-test was performed for comparing any two groups, and an analysis of variance was performed for comparing the three groups. Differences were considered statistically significant at p < 0.05.
Results
Cytoskeletal and tight junction proteins were deregulated in the skin lesions of HHD
The IHC analysis showed that the levels of SPCA1, F-actin, P-cofilin, claudin 1, claudin 4, occludin, and ZO-1 were high in the normal epidermis and low in the HHD lesions [Figures 1a and 1b]. Their quantitative analysis using ImageJ showed decreased levels of these proteins [Figure 1c].
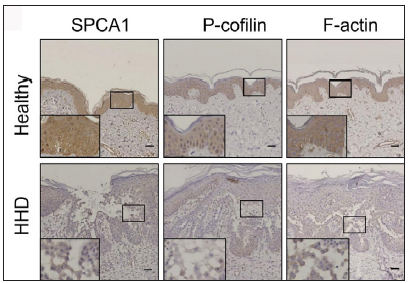
- SPCA1, cytoskeletal, and tight junction proteins are poorly expressed in the skin lesions of patients with HHD. Immunohistochemistry (IHC) was performed for the protein expression in the paraffin sections. SPCA1, Secretory pathway Ca2+/Mn2+ Adenosine Triphosphatase pump type 1; HHD, Hailey– Hailey disease.
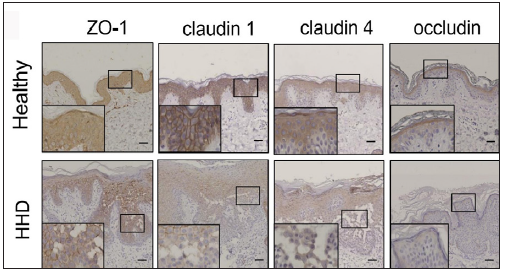
- SPCA1, cytoskeletal, and tight junction proteins are poorly expressed in the skin lesions of patients with HHD. Immunohistochemistry (IHC) was performed for the protein expression in the paraffin sections. HHD, Hailey– Hailey disease; ZO-1, zonula occludens protein 1.
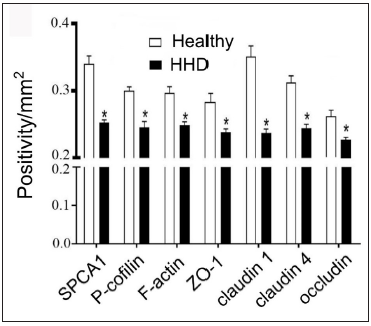
- SPCA1, cytoskeletal, and tight junction proteins are poorly expressed in the skin lesions of patients with HHD. ImageJ and GraphPad Prism 8.0 software determined the intensities of protein expressions. Scale bar = 50 µm. *p < 0.05, compared to the healthy donors. SPCA1, Secretory pathway Ca2+/Mn2+ Adenosine Triphosphatase pump type 1; HHD, Hailey–Hailey disease; ZO-1, zonula occludens protein 1.
ATP21C was inhibited in cultured keratinocytes by shRNA transfection
The keratinocytes exhibited morphological changes after shRNA transfection and returned to normal 96 after transfection, suggesting successful transfection (Supplementary Figure 1). The immunofluorescence analysis showed that SPCA1 levels decreased significantly in the ATP2C1 shRNA group with no difference between the two controls (p < 0.050) [Figure 2a]. Conformably, ATP2C1 mRNA and SPCA1 levels decreased in the ATP2C1 shRNA group [Figures 2b and 2c].
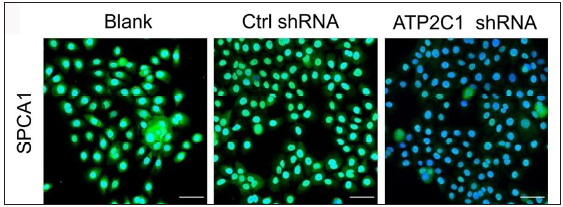
- Successful transfection of ATP2C1 shRNA in keratinocytes. Immunofluorescence was performed to detect the SPCA1 expression. ATP2C1, Adenosine Triphosphatase calcium-transporting type 2C member 1 gene; SPCA1, Secretory pathway Ca2+/Mn2+ Adenosine Triphosphatase pump type 1.
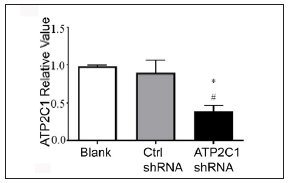
- Transfection of ATP2C1 shRNA in keratinocytes. The mRNA expression of ATP2C1 was determined in cells. *p < 0.05, compared to the blank groups; #p < 0.05, compared to the control shRNA group. ATP2C1, Adenosine Triphosphatase calcium-transporting type 2C member 1 gene.
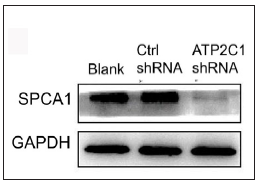
- Successful transfection of ATP2C1 shRNA in keratinocytes. The expression of SPCA1 was analysed by Western blotting technique. ATP2C1, Adenosine Triphosphatase calcium-transporting type 2C member 1 gene; SPCA1, Secretory pathway Ca2+/Mn2+ Adenosine Triphosphatase pump type 1; GAPDH, glyceraldehyde-3-phosphate dehydrogenase.
The transmission electron microscopy (TEM) results showed that the cells in the blank group exhibited no swelling. Several tight junctions were observed between the cells with narrow intercellular space. The cells in the control shRNA group showed mild swelling, with lesser intercellular tight junctions accompanied by more expansive intercellular space. The shRNA-transfected cells showed swelling with a few tight junctions and widened intercellular space [Figure 2d].
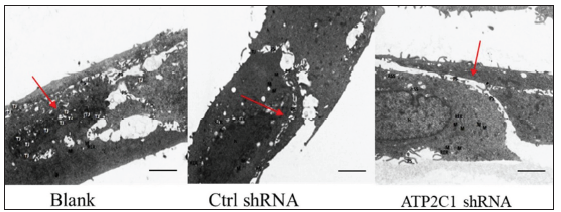
- Successful transfection of ATP2C1 shRNA in keratinocytes. Electron microscopic structure of keratinocytes after ATP2C1 gene knockout. Red arrows represent intercellular space. Scale bar = 2.5 µm. ATP2C1: Adenosine Triphosphatase calcium-transporting type 2C member 1 gene.
ATP2C1 knockdown suppressed P-cofilin and F-actin
We examined the levels of P-cofilin and F-actin in the cells using immunofluorescence. Compared with the blank group, the control shRNA group showed minimal changes in P-cofilin and F-actin levels. However, the shRNA-transfected cells showed significantly reduced fluorescence intensity (p < 0.05), accompanied by considerably decreased F-actin ring formation around the cell periphery and reduced F-actin filamentous pseudopodia between the cells [Figures 3a and 3b]. Compared with the blank and control shRNA groups, the ATP2C1 shRNA group showed lower P-cofilin mRNA transcript levels (p < 0.050) [Figure 3c]. Consistently, the western blotting technique results showed decreased P-cofilin and F-actin levels after shRNA transfection. (p < 0.05) [Figures 3d and 3e].
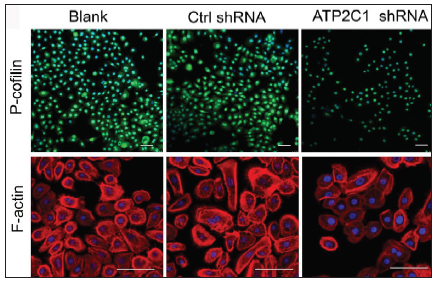
- The expressions of P-cofilin and F-actin are reduced after shRNA transfection in keratinocytes. Immunofluorescence was performed for the P-cofilin and F-actin expression. ATP2C1, Adenosine Triphosphatase calcium-transporting type 2C member 1 gene. Scale bar = 20 µm.
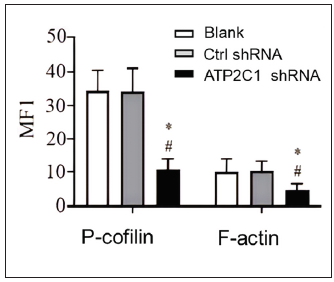
- The expressions of P-cofilin and F-actin are reduced after shRNA transfection in keratinocytes. The fluorescence intensities were quantitated by using the ImageJ and GraphPad Prism 8.0 software. ATP2C1, Adenosine Triphosphatase calcium-transporting type 2C member 1 gene. *p < 0.05, compared to the blank groups; #p < 0.05, compared to the control shRNA group.
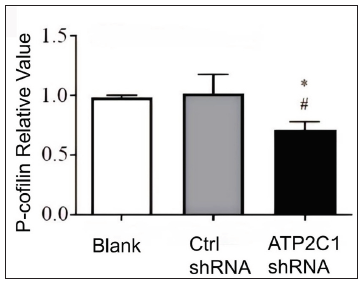
- The expressions of P-cofilin and F-actin are reduced after shRNA transfection in keratinocytes. The mRNA levels of P-cofilin in the cells were assessed after shRNA transfection. *p < 0.05, compared to the blank groups; #p < 0.05, compared to the control shRNA group. ATP2C1, Adenosine Triphosphatase calcium-transporting type 2C member 1 gene.
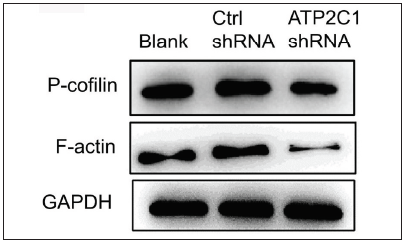
- The expressions of P-cofilin and F-actin are reduced after shRNA transfection in keratinocytes. The protein expressions were detected by Western blotting technique. GAPDH, glyceraldehyde-3-phosphate dehydrogenase; ATP2C1, Adenosine Triphosphatase calcium-transporting type 2C member 1 gene.
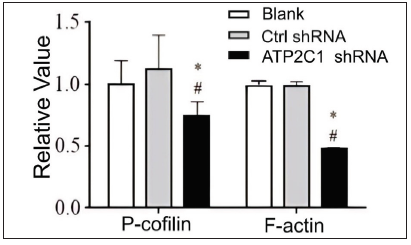
- Proteins of P-cofilin and F-actin were reduced after shRNA transfection in keratinocytes. The ImageJ software measured the band intensities. Data were from three independent experiments. ATP2C1, Adenosine Triphosphatase calcium-transporting type 2C member 1 gene. *p < 0.05, compared to the blank group; #p < 0.05, compared to the control shRNA group.
The levels of tight junction proteins decreased after ATP2C1 knockdown
We detected the levels of claudin 1, claudin 4, occludin, and ZO-1 by immunofluorescence and simultaneously performed F-actin co-staining. The fluorescent intensities of F-actin and the four tight junction proteins in the ATP2C1 shRNA group were significantly lower (p < 0.05), and no significant difference was observed between the two control groups [Figures 4a and 4b].
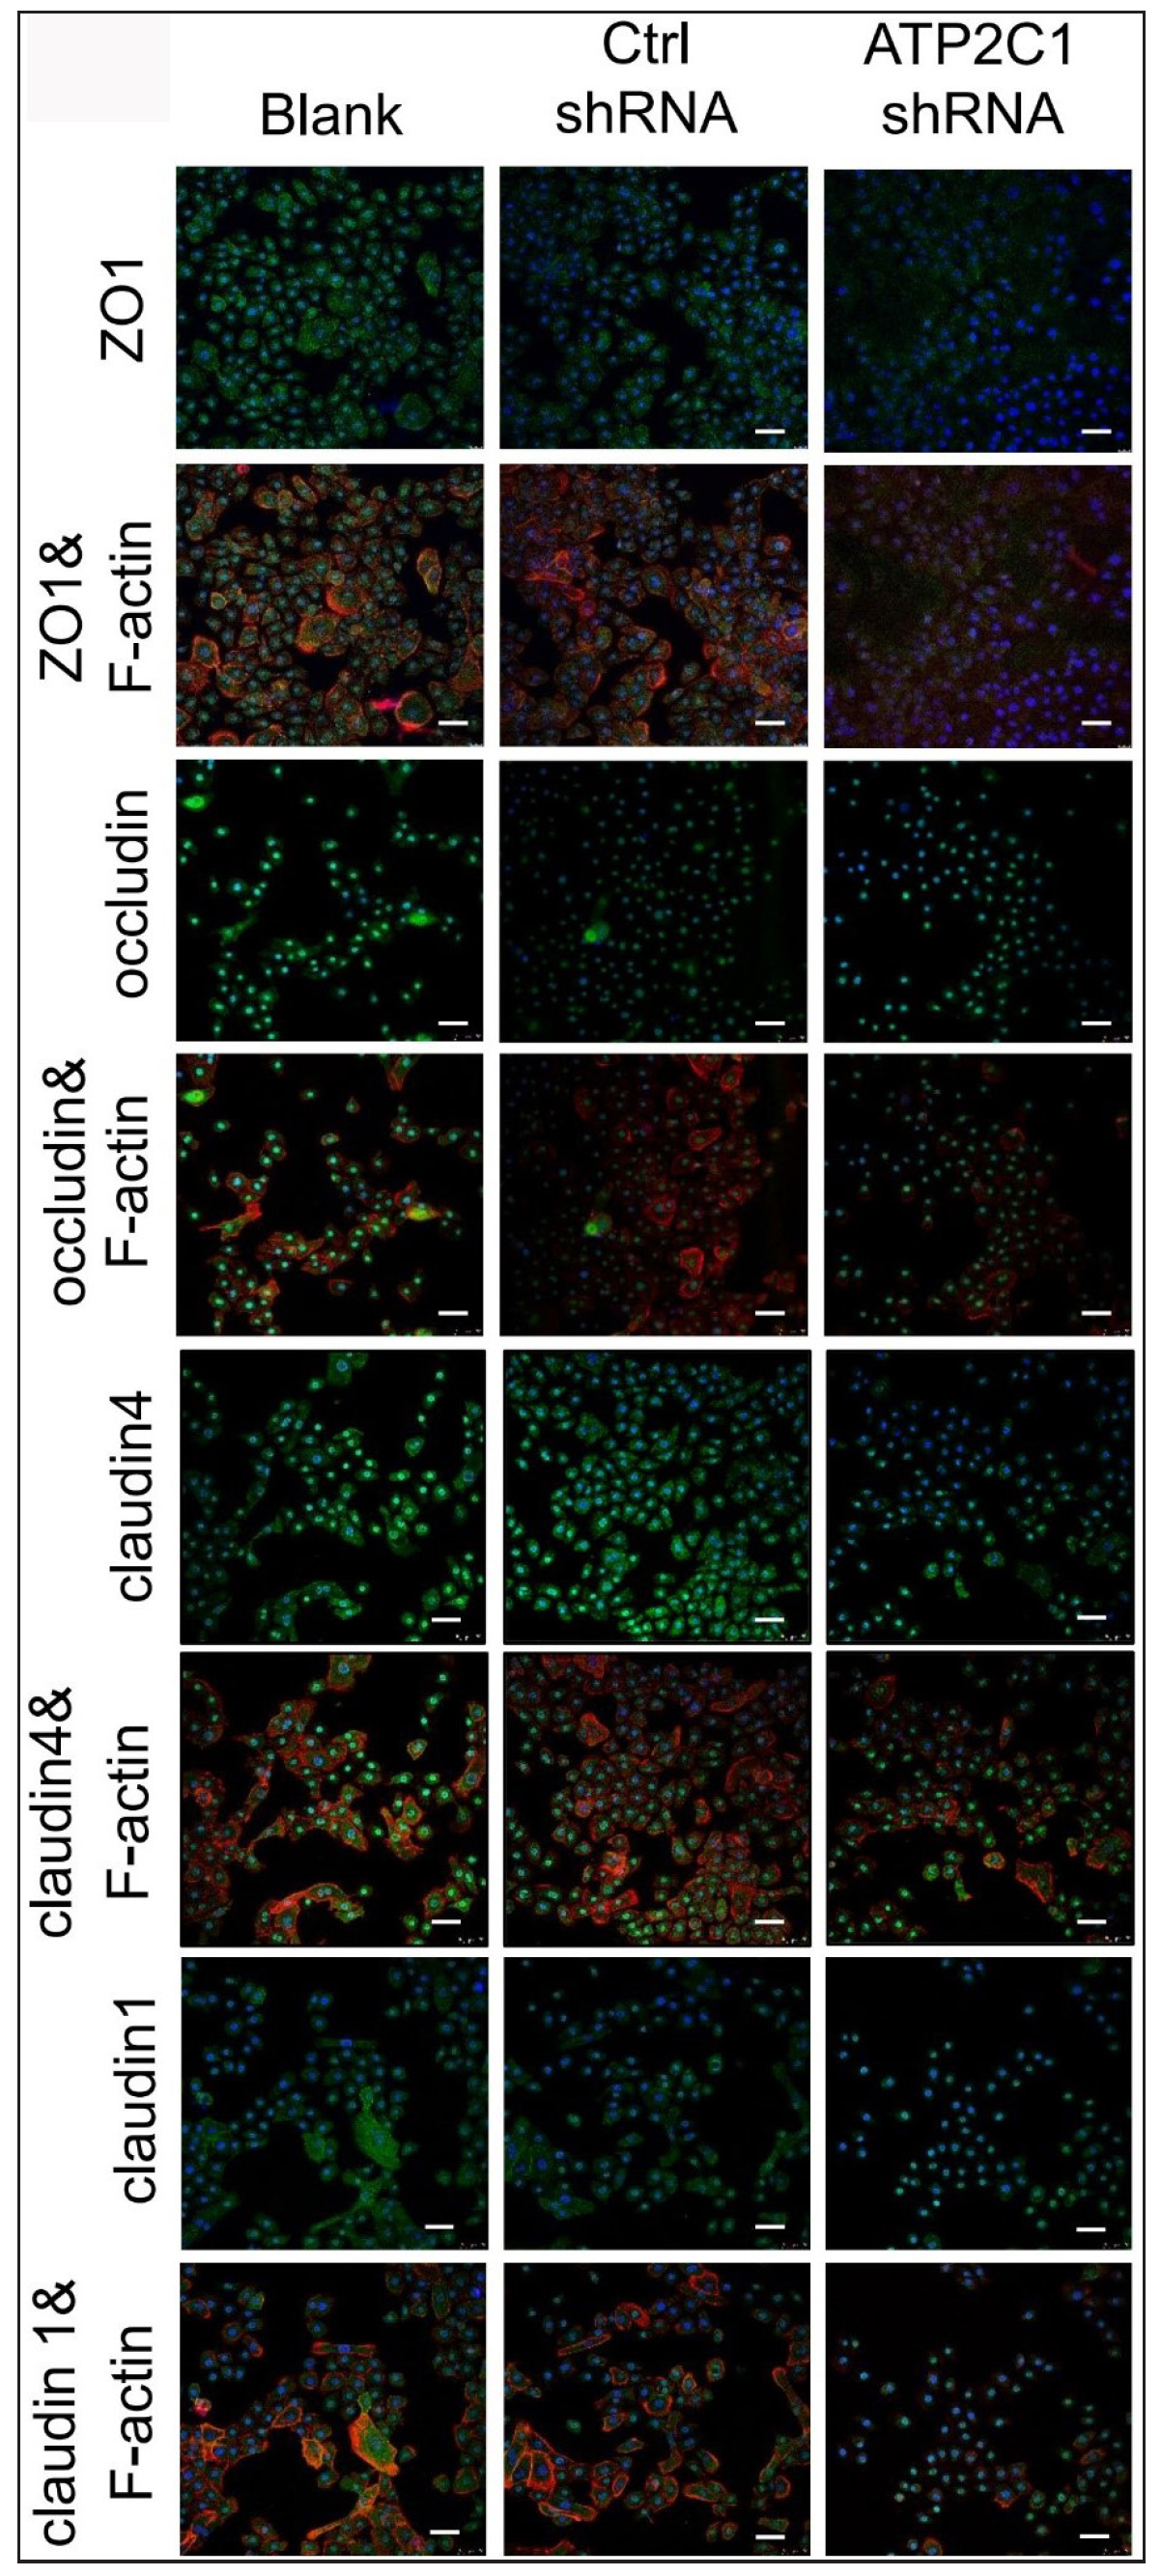
- The expressions of tight junction proteins after shRNA transfection in keratinocytes. Immunofluorescence was performed to detect the expression of tight junction proteins in the cells. ATP2C1, Adenosine Triphosphatase calcium-transporting type 2C member 1 gene; ZO-1, zonula occludens protein 1. Scale bar = 50 µm.
- The expressions of tight junction proteins after shRNA transfection in keratinocytes. ImageJ and GraphPad Prism 8.0 software quantified the fluorescence intensity of the tight junction proteins. *p < 0.05, compared to the blank groups; #p < 0.05, compared to the control shRNA group. ATP2C1, Adenosine Triphosphatase calcium-transporting type 2C member 1 gene; ZO-1, zonula occludens protein 1.
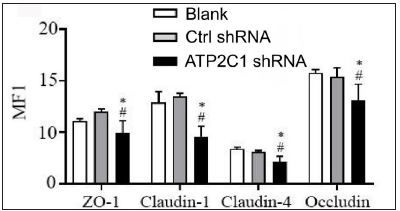
Further, we analysed the mRNA and protein levels of the tight junction proteins. The mRNA levels of claudin 1, claudin 4, occludin, and ZO-1 in the ATP2C1 shRNA group decreased significantly compared with those in the two control groups (p < 0.05). [Figure 4c]. The western blotting technique results showed that the levels of the four tight junction proteins were lower in the ATP2C1 shRNA group (p < 0.05), and no significant differences were observed between the two control groups [Figures 4d and 4e].
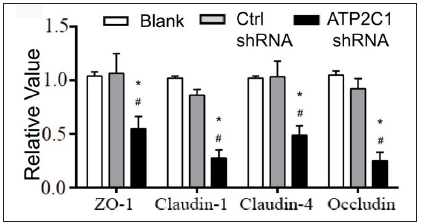
- The mRNA levels of tight junction proteins after shRNA transfection in keratinocytes. ATP2C1, Adenosine Triphosphatase calcium-transporting type 2C member 1 gene; ZO-1, zonula occludens protein 1. *p < 0.05, compared to the blank groups; #p < 0.05, compared to the control shRNA group.
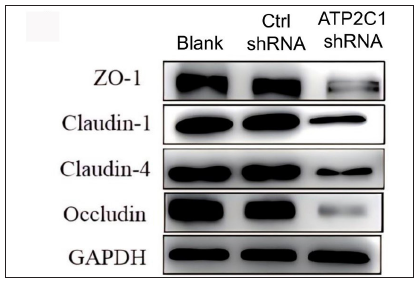
- The protein levels of tight junction proteins in keratinocytes were determined by Western blotting technique following shRNA transfection. ATP2C1, Adenosine Triphosphatase calcium-transporting type 2C member 1 gene; GAPDH, glyceraldehyde-3-phosphate dehydrogenase; ZO-1, zonula occludens protein 1.
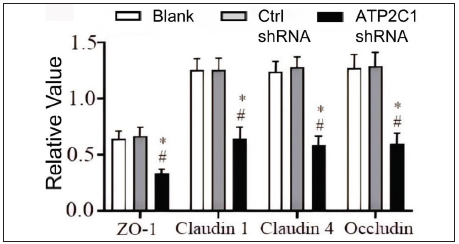
- The protein levels of tight junction proteins in keratinocytes were determined by Western blotting technique following shRNA transfection. The ImageJ software measured the intensity of protein bands. Data were from three independent experiments. ATP2C1, Adenosine Triphosphatase calcium-transporting type 2C member 1 gene; ZO-1, zonula occludens protein 1. *p < 0.05, compared to the blank groups; #p < 0.05, compared to the control shRNA group.
Cell apoptosis and intracellular Ca2+ influx were not affected by ATP2C1 knockdown
The flow cytometry results showed that apoptosis ratios were similar between the three groups [Figures 5a and 5b]. The CCK-8 analysis showed that cell proliferation in the ATP2C1 shRNA group was not altered [Figure 5c]. We detected intracellular Ca2+ concentrations in the keratinocytes using fluorescent microplates. However, no difference was observed in intracellular Ca2+ concentrations among the three groups [Figure 5d].
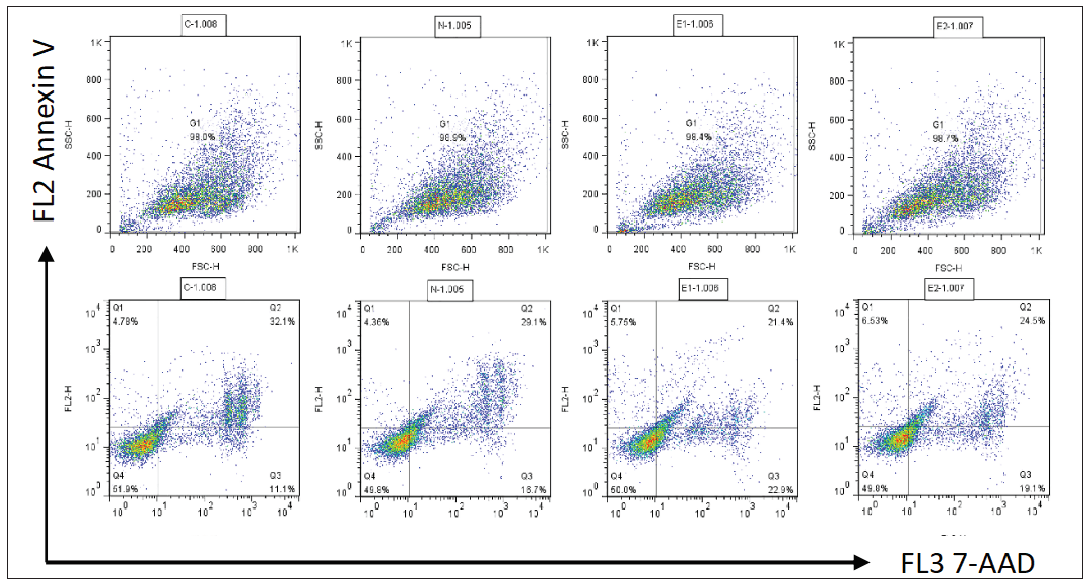
- The effect of ATP2C1 gene knockdown on apoptosis was detected through flow cytometry. 7-ADD, 7-amino actinomycin D; Annexin V, annexin V-phycoerythrin; ATP2C1, Adenosine Triphosphatase calcium-transporting type 2C member 1 gene.
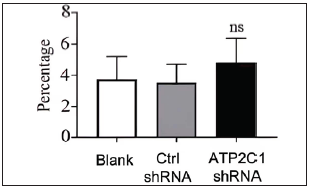
- The effect of ATP2C1 gene knockdown on apoptosis was detected through flow cytometry. The ratios of apoptotic cells were quantified by ImageJ software. ATP2C1, Adenosine Triphosphatase calcium-transporting type 2C member 1 gene. ns, no statistical difference.
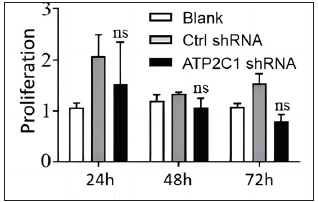
- The effect of ATP2C1 gene knockdown on proliferation was measured by cell counting kit-8 (CCK-8). ns, no statistical difference. ATP2C1, Adenosine Triphosphatase calcium-transporting type 2C member 1 gene.
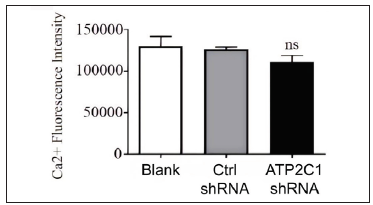
- The effect of ATP2C1 gene knockdown on intracellular Ca2+ concentration was assessed using Fluo-3 Acetoxymethyl Ester (fluo-3 AM). ns, no statistical difference. ATP2C1, Adenosine Triphosphatase calcium-transporting type 2C member 1 gene.
Discussion
The present study showed the dysregulation of cytoskeletal and tight junction proteins in HHD skin lesions. Moreover, a stable in vitro cell model of epidermal acantholysis with ATP2C1 knockdown was successfully established in human keratinocytes. The levels of the cytoskeletal and tight junction proteins decreased because of a decrease in SPCA1 expression. Furthermore, cell apoptosis and proliferation, as well as intracellular Ca2+ influx, remained unaffected after ATP2C1 knockdown.
A study showed that SPCA1 stabilises the actin cytoskeleton by interacting with cofilin, which is bound to the phosphorylated region of SPCA1 in HeLa cells.7 ATP2C1 controlled mouse neural tube closure by regulating cytoskeletal dynamics.12 ATP2C1 deficiency increased claudin and occludin levels in keratinocytes and decreased ZO-1 levels.4 We examined the tight junction proteins in the lesion tissues and keratinocytes (in vitro model). SPCA1 maintains a balance between the levels of cytoskeletal and tight junction proteins,4 and the present findings are consistent with this observation. Conversely, the present study showed that P-cofilin and F-actin levels decreased in the skin lesions of patients with HHD. Moreover, their levels also fell in the cultured keratinocytes after a decrease in SPCA1 expression. Thus, these results support the function of SPCA1 in regulating structural proteins related to epidermal acantholysis.
Currently, no suitable HHD animal model explicitly targets ATP2C1 mutations.13,14 Different cell models for acantholysis exhibit poor efficiency and low stability for gene downregulation.15 A yeast-based HHD model has limitations in mimicking in vivo conditions.16 Thus, to better simulate HHD, we performed shRNA lentiviral transfection in human primary keratinocytes. The results showed that both the mRNA level of ATP2C1 and the protein level of SPCA1 decreased significantly in the shRNA-transfected keratinocytes, and this characteristic was maintained even after multiple passages. Thus, we could successfully establish a cell model of HHD-like acantholysis with higher and more stable transfection efficiencies.
Cofilin binds to SPCA1 at the trans-Golgi network to recruit F-actin and results in Ca2+ pump activation, thereby inducing Ca2+ influx into a specific domain of the trans-Golgi network.17 Epithelial cells use accumulated Ca2+ and F-actin to participate in cell adhesion and tight junction connections.18 Herein, we observed decreased levels of P-cofilin in the HHD cell model. The immunofluorescence results revealed a significant reduction in the fluorescence intensities of F-actin and P-cofilin in the ATP2C1-knockdown cells. The western blotting results supported this finding. These results showed that decreased P-cofilin levels caused the abnormal distribution of F-actin, suggesting its crucial role in HHD pathogenesis.
A study showed that the levels of tight junction proteins differed in keratinocytes cultured with different concentrations of Ca2+.4 Considering the effect of ATP2C1 expression on the cellular Ca2+ concentration gradient,19 we examined intracellular Ca2+ concentrations. No difference was observed in intracellular Ca2+ concentrations among the three cell groups. This finding contrasted with Hu et al.’s study.20 However, their study demonstrated that when two other calcium pumps were inhibited in keratinocytes cultured from patients with HHD, the cellular Ca2+ regulatory function significantly decreased. However, when the inhibition of the Na+/Ca2+ antiporter was reversed, the intracellular calcium concentration returned to normal, underscoring the pivotal role of Na+/Ca2+ antiporter in maintaining intracellular calcium levels. Furthermore, another study indicated that the Ca2+ concentration in keratinocytes derived from the skin of patients with HHD showed no difference compared with those derived from normal individuals, which aligns with our findings.21,22 Thus, we believe the intracellular Ca2+ concentration in keratinocytes that mimic HHD requires further investigation. The embryonic lethality observed in mice with ATP2C1 mutations is probably associated with extensive cell apoptosis,13 and Ca2+ ions play a crucial role in mitochondrial apoptosis and cell apoptosis induction in HeLa cells.22 Thus, we examined keratinocyte proliferation and apoptosis after ATP2C1 knockout. ATP2C1 knockdown did not affect cell apoptosis and proliferation, suggesting that keratinocyte proliferation and apoptosis were unrelated to epidermal acantholysis in HHD.
Limitations
Our study was confined to cellular and tissue studies due to the unavailability of suitable animal models for HHD; thus, it may not ideally mimic the real in vivo environment. Given the rarity of HHD and the hesitancy of some patients to undergo skin biopsies, the number of patient samples acquired were comparatively limited. Additionally, we delved into the regulatory impact of ATP2C1 inhibition on skeletal proteins and tight junction proteins, but our examination of their connection was somewhat constrained, and it awaits further study.
Conclusion
In summary, defects in ATP2C1 play a pivotal role in HHD pathogenesis, and a decrease in SPCA1 expression in keratinocytes mimics multiple features of epidermal acantholysis. Thus, the present in vitro cell model may be used to explore treatment strategies for HHD. Moreover, a reduction in SPCA1 expression is associated with decreased P-cofilin and F-actin levels, thereby shedding light on the potential therapeutic targets for treating patients with HHD. Therefore, future studies should focus on the association between P-cofilin/F-actin and tight junction proteins in HHD.
Ethical approval
The research was approved by the Institute Ethical Committee of Xi’an Jiaotong University, with the assigned approval number 2016028.
Declaration of patient consent
The authors certify that they have obtained all appropriate patient consent.
Financial support and sponsorship
Nil.
Conflicts of interest
There are no conflicts of interest.
Use of artificial intelligence (AI)-assisted technology for manuscript preparation
The authors confirm that there was no use of artificial intelligence (AI)-assisted technology for assisting in the writing or editing of the manuscript, and no images were manipulated using AI.
References
- Transcriptional profiling of rare acantholytic disorders suggests common mechanisms of pathogenesis. JCI Insight 2023:e168955.
- [CrossRef] [PubMed] [PubMed Central] [Google Scholar]
- Two novel and a recurrent ATP2C1 mutations in Chinese population with Hailey-Hailey disease. Clin Cosmet Investig Dermatol. 2023;16:1545-8.
- [CrossRef] [PubMed] [PubMed Central] [Google Scholar]
- Altered levels of focal adhesion and extracellular matrix-receptor interacting proteins were identified in Hailey-Hailey disease by quantitative iTRAQ proteome analysis. J Cell Biochem. 2019;120:3801-12.
- [CrossRef] [PubMed] [Google Scholar]
- Hailey-Hailey disease and tight junctions: Claudins 1 and 4 are regulated by the ATP2C1 gene encoding Ca(2+) /Mn(2+) ATPase SPCA1 in cultured keratinocytes. Exp Dermatol. 2012;21:586-91.
- [CrossRef] [PubMed] [PubMed Central] [Google Scholar]
- ZO-1 and ZO-2 independently determine where claudins are polymerized in tight-junction strand formation. Cell. 2006;126:741-54.
- [CrossRef] [PubMed] [Google Scholar]
- The tight junction: A multifunctional complex. Am J Physiol Cell Physiol. 2004;286:C1213-28.
- [CrossRef] [PubMed] [Google Scholar]
- Cofilin recruits F-actin to SPCA1 and promotes Ca2+-mediated secretory cargo sorting. J Cell Biol. 2014;206:635-54.
- [CrossRef] [PubMed] [PubMed Central] [Google Scholar]
- Identification of ATP2C1 mutations in the patients of Hailey-Hailey disease. BMC Med Genet. 2020;21:120.
- [CrossRef] [PubMed] [PubMed Central] [Google Scholar]
- TNF-like weak inducer of apoptosis promotes angiogenesis, thereby exacerbating cutaneous psoriatic disease. J Invest Dermatol. 2021;141:1356-60.
- [CrossRef] [PubMed] [Google Scholar]
- TWEAK/Fn14 interaction confers aggressive properties to cutaneous squamous cell carcinoma. J Invest Dermatol. 2019;139:796-806.
- [CrossRef] [PubMed] [Google Scholar]
- Inverse correlation of intracellular calcium and cyclic AMP levels in renal cell carcinoma. Cell Biochem Funct. 2012;30:619-22.
- [CrossRef] [PubMed] [Google Scholar]
- Secretory pathway calcium ATPase 1 (SPCA1) controls mouse neural tube closure by regulating cytoskeletal dynamics. Development. 2018;145:dev170019.
- [CrossRef] [PubMed] [PubMed Central] [Google Scholar]
- Loss of the Atp2c1 secretory pathway Ca(2+)-ATPase (SPCA1) in mice causes Golgi stress, apoptosis, and midgestational death in homozygous embryos and squamous cell tumors in adult heterozygotes. J Biol Chem. 2007;282:26517-27.
- [CrossRef] [PubMed] [Google Scholar]
- Squamous cell carcinoma arising from a localized vulval lesion of Hailey-Hailey disease after tacrolimus therapy. Am J Obstet Gynecol. 2010;203:e5-7.
- [CrossRef] [PubMed] [Google Scholar]
- Identification of several mutations in ATP2C1 in Lebanese families: Insight into the pathogenesis of Hailey-Hailey disease. PLoS One. 2015;10:e0115530.
- [CrossRef] [PubMed] [PubMed Central] [Google Scholar]
- Using yeast to model calcium-related diseases: Example of the Hailey-Hailey disease. Biochim Biophys Acta. 2014;1843:2315-21.
- [CrossRef] [PubMed] [Google Scholar]
- Exploring new routes for secretory protein export from the trans-Golgi network. Mol Biol Cell. 2018;29:235-40.
- [CrossRef] [PubMed] [PubMed Central] [Google Scholar]
- Directed actin polymerization is the driving force for epithelial cell-cell adhesion. Cell. 2000;100:209-19.
- [CrossRef] [PubMed] [Google Scholar]
- Generalized Hailey-Hailey disease: Novel splice-site mutations of ATP2C1 gene in Chinese population and a literature review. Mol Genet Genomic Med. 2020;9:e1580-e1594.
- [CrossRef] [PubMed] [PubMed Central] [Google Scholar]
- Mutations in ATP2C1, encoding a calcium pump, cause Hailey-Hailey disease. Nat Genet. 2000;24:61-5.
- [CrossRef] [PubMed] [Google Scholar]
- Keratinocytes cultured from patients with Hailey-Hailey disease and Darier disease display distinct patterns of calcium regulation. Br J Dermatol. 2005;153:113-7.
- [CrossRef] [PubMed] [Google Scholar]
- Crosstalk among calcium ATPases: PMCA, SERCA and SPCA in mental diseases. Int J Mol Sci. 2021;22:2785-808.
- [CrossRef] [PubMed] [PubMed Central] [Google Scholar]