Translate this page into:
Point counting-serial image index: A new scoring system for melasma
Corresponding author: Dr. Garehatty Rudrappa Kanthraj, Department of Dermatology, JSS Medical College and Hospital, JSS Academy of Higher Education(Deemed to be University), Mysuru, Karnataka, India. kanthacad@yahoo.com
-
Received: ,
Accepted: ,
How to cite this article: Srishti D, Chethana SG, Kanthraj GR, Betkerur JB. Point counting-serial image index: A new scoring system for melasma. Indian J Dermatol Venereol Leprol 2023;89:307-9.
Sir,
Melasma area and severity index1 (MASI) and modified MASI score2 (mMASI) are most commonly used to assess melasma severity. However, these scores are subjective with complex formulas.
The objective was to propose, validate and compare a new melasma score point counting-serial image (PCSI) index with mMASI and assess its possible advantage and disadvantages over mMASI.
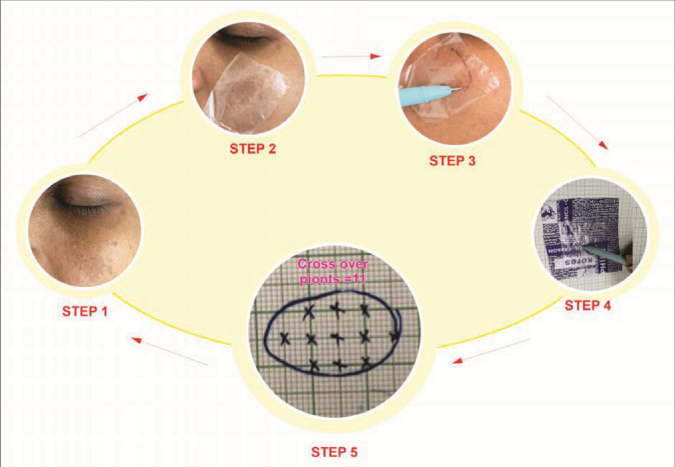
PCSI is calculated by considering two parameters: (1) the area involved by melasma and (2) the intensity of pigmentation. The area assessment was performed by the point counting method of Bahmer.3 A transparent polythene sheet was used to trace the hyperpigmented borders of melasma. This was impregnated into a graph using carbon paper. The number of crossover points lying inside the traced boundary was counted. Sum of the points gave the total area of involvement. Grid size can be either in millimetres or centimetres, however, it has to be constant and expressed as a number, i.e., it is a count of cross-over points [Figure 1a].

- Illustrates the process involved in point counting serial image index. Step 1- identifying an index/reference image-includes melasma lesion along with adjoining normal skin for comparison. Step 2- Transparent polythene sheet is superimposed over a melasma lesion. Step 3- The margins of the lesion is traced. Step 4- Transparent sheet is superimposed over a carbon paper and traced on a graph paper. Step 5- The cross-over points are counted within the traced boundary. The number of cross over points represents the melasma area. In this case there are 11 cross - over points
The intensity of pigmentation was recorded on a 0–5 scale (5 = 100%, 4 = 80%, 3 = 60%, 2 = 40%, 1 = 20%, 0 = 0%). Serial images with the same camera (1242x2699 pixels, iPhone XS Max by Apple inc., California) under standard conditions with fixed distance, illumination etc. were recorded at a 3-week-interval [Figure 1b]. The first image of the pigmented area was recorded as 5 in each patient and it served as the reference image. Any further decline in the intensity of pigmentation was recorded with reference to that image. If there is no decline or increase in the intensity of pigmentation, it was recorded as 5 in the follow-up visit. PCSI score is calculated as the product of area of involvement (A) and intensity of pigmentation (I).

- Periodic images of the patient taken in three views. The serial mMASI, PCSI and PSS were recorded at 3-week-intervals. (mMASI: Modified melasma area severity index, PCSI: Point counting serial image index and PSS: Patient satisfaction score)
A comparative study involving melasma patients was performed was done in the outpatients' department of dermatology. Patients who finished at least one follow-up visit were included. Scattered pigmentation was excluded. Informed consent was taken before taking the photographs.
In each patient, scores were calculated both by PCSI and mMASI during baseline and the first follow-up visit. Regression of scores obtained by both methods was observed. In the follow-up visit, the percentage of improvement perceived by the patient with treatment was recorded as a patient satisfaction score, with a range from 0 to 100%.
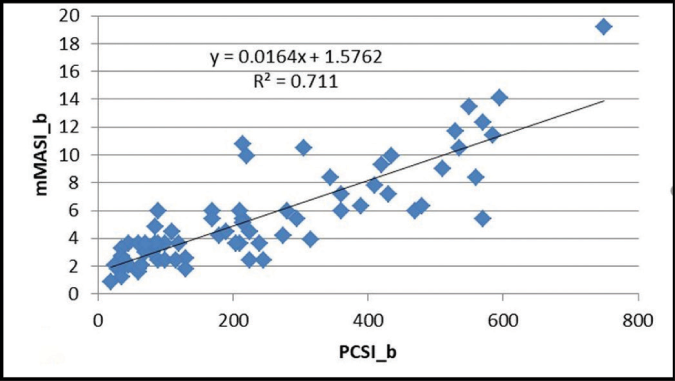
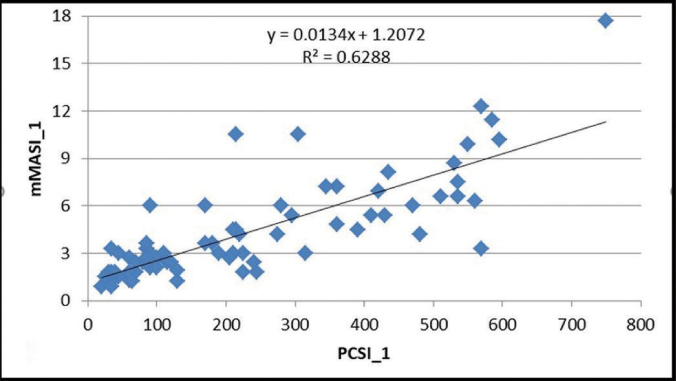
We enrolled 120 patients, 25 (21%) and 95 (79%) males and females, respectively. Mean PCSI scores in the baseline and follow-up visit were 238.54 ± 188.46 and 208.87 ± 167.56, respectively [Table 1]. The mean mMASI scores in the baseline and follow-up visits were 5.52 ± 3.62 and 4.45 ± 3.19, respectively. A significant correlation was observed between PCSI Index and mMASI (Pearson coefficient = 0.846 and 0.837). [Figures 2a and b] The values decreased from baseline to the follow-up visit (P value 0.001). PCSI and mMASI scores were inversely related to patient satisfaction scores.
| Pair | The difference in mean score | Standard deviation | P-value |
|---|---|---|---|
| mMASI b*- mMASI1† | 1.07 | 1.090 | 0.001 |
| PCSI b-PCSI 1 | 32.46 | 38.953 | 0.001 |

- The correlation between modified melasma area severity index (mMASI) and point counting-serial image index (PCSI) scores, baseline visit

- The correlation between melasma area severity index (mMASI) and point counting-serial image index (PCSI) scores after first follow-up
Modern instruments like reflectance spectroscopy provide objective and reproducible results.4 However, they are expensive and measurements can be time-consuming.4 We chose a simple method of cross-over point counting3 for area measurement and digital photography to assess the intensity of pigmentation. The change in colour was assessed by comparing serial images with the patient’s reference image.
The intensity of pigmentation was recorded as 5 (100%) for every patient at the baseline visit and this served as a reference image for that particular patient. This is compared with serial images to find any difference in pigmentation in the subsequent visit. However, in mMASI, the score for darkness is subjective even in the first visit, for example, if the assessor feels that the pigmentation is very dark, he will record it as four, if just dark then three and so on. This leads to significant inter-assessor variability. Moreover, the darkness component changes according to skin type. If the patient is fair, the same intensity of pigmentation will be perceived as darker than in dark patients. However, our method compares serial images with that patient’s own reference image. This gives a better understanding of change in score with treatments. Photo-documentation in the proposed PCSI compares serial images with the patient’s own reference image, reduces inter-assessor variation and helps in patient understanding of the degree of improvement with treatment.
Calculation of MASI1 score is by subjective assessment of area (A) of involvement, darkness (D) and homogeneity (H). In 2011, it was demonstrated1 that the removal of homogeneity did not change the reliability and validity measures. Therefor it was removed from the calculation (mMASI). Recently, a new score the melasma severity index is proposed.5 Our study validated and compared PCSI with mMASI score on the following counts: (1) there was a decrease in mean mMASI as well as PCSI scores with treatment in subsequent follow-up visits (2) There was a significant correlation between PCSI and mMASI scores (3) PCSI score decreased with treatment similar to mMASI score.
The advantages of this method are an objective assessment of the area, simple calculation and useful in comparing the scores of the same patient before and after treatment. The disadvantages are an area of scattered pigmentation cannot be calculated. There is no range of scores. This method cannot be used across individuals. A scale should have a minimum and maximum value, however, as we took a direct measurement of the area of pigmentation, the range of scores was not possible.
PCSI is comparable to mMASI. Easy calculations and direct area assessment of PCSI overcome the shortcomings of mMASI. mMASI can be applied across individuals. However, serial images in PCSI provide a better comparison of scores following treatment in a given patient.
Acknowledgement
We are thankful to Dr. Lancy D’Souza, Reader in Psychology, Maharaja’s College, University of Mysore, Karnataka for the statistical analysis of the data. We acknowledge JSS Academy of Higher Education (JSSAHER) for their constant academic encouragement and constructive suggestions in completing this project.
Declaration of patient consent
Patients’ consent not required as patients’ identities are not disclosed or compromised.
Conflict of interest
There are no conflicts of interest.
Financial support and sponsorship
Nil.
References
- Reliability assessment and validation of the Melasma Area and Severity Index (MASI) and a new modified MASI scoring method. J Am Acad Dermatol. 2011;64:78-83.
- [CrossRef] [PubMed] [Google Scholar]
- Reliability, validity, and sensitivity to change overtime of the modified melasma area and severity index score. Dermatol Surg. 2017;43:210-7.
- [CrossRef] [PubMed] [Google Scholar]
- Wound measurement made truly simple by point counting. Arch Dermatol. 1999;135:991-2.
- [CrossRef] [PubMed] [Google Scholar]
- Noninvasive techniques for the evaluation of skin color. J Am Acad Dermatol. 2006;54:282-90.
- [CrossRef] [PubMed] [Google Scholar]
- Proposing melasma severity index: A new, more practical, office-based scoring system for assessing the severity of melasma. Indian J Dermatol. 2016;61:39-44.
- [CrossRef] [PubMed] [Google Scholar]


