Translate this page into:
Comparative host transcriptomics as a tool to identify candidate biomarkers for immune reactions in leprosy using meta-analysis

Corresponding author: Dr. Pushpendra Singh, Department of Microbial Pathogenesis and Genomics Laboratory, Indian Council of Medical Research-National Institute of Research in Tribal Health, Jabalpur, Madhya Pradesh, India. psjalma@gmail.com
-
Received: ,
Accepted: ,
How to cite this article: Mavlankar A, Sharma M, Ansari A, Singh P. Comparative host transcriptomics as a tool to identify candidate biomarkers for immune reactions in leprosy using meta-analysis. Indian J Dermatol Venereol Leprol. 2024;90:731-41. doi: 10.25259/IJDVL_532_2022
Abstract
Background
Leprosy is no longer considered an imprecation, as an effective multidrug therapy regimen is available worldwide for its cure. However, its diverse clinical manifestations sometimes involve acute inflammatory reactions. These complications result in irreversible nerve damage, neuritis and anatomical deformities that emerge before, during the treatment or after the completion of treatment. Reversal reaction (Type-I) and erythema nodosum leprosum (Type-II) are the leprosy reactions generally seen in patients with lepromatous and borderline forms of leprosy. At present, there is no accurate diagnostic test available to detect these leprosy reactions.
Objectives
To identify potential biomarkers indicative of Type-I and Type-II leprosy reactions that could help in their early diagnosis.
Methods and Results
Host-transcriptomics investigations have been utilised in this study to decipher a correlation between host-gene expression-based biomarkers and exacerbation of leprosy reactions. We present a comparative analysis of publicly available host transcriptomics datasets (from Gene Expression Omnibus) related to leprosy reactions. Individual datasets were analysed and integration of results was carried out using meta-analysis. Common differentially expressed genes (DEGs) were identified using the frequentist and Bayesian ratio association test methods. We have identified several genes – ADAMTS5, ADAMTS9, IFITM2, IFITM3, KIRREL, ANK3, CD1E, CTSF, DOCK9 and KRT73 to name a few – which can serve as potential biomarkers for Type-II reaction. Similarly, ACP5, APOC1, CCL17, S100B, SLC11A1 among others may likely serve as biomarkers for Type-I reaction.
Limitations
The number of datasets related to leprosy reactions found after the systematic search is less (n = 4) and may limit the accuracy of identified biomarker genes. This could be resolved by including more studies in the data analysis.
Conclusion
We provide a comprehensive list of gene candidates which could be prioritised further in research focusing on immune reactions in leprosy, as they are likely important in understanding its complexities and could be useful in its early diagnosis.
Keywords
biomarker
differentially expressed genes
erythema nodosum leprosum
host transcriptomics
reversal reaction

Introduction
Leprosy reactions are acute inflammatory episodes that occur during infection with Mycobacterium leprae.1 These reactions pose a high risk to the infected individuals, resulting in physical deformity followed by nerve damage. Leprosy reactions are classified into two types: Type-I or reversal reactions and Type-II or commonly presenting as erythema nodosum leprosum (ENL).2 Both types of reactions may occur in leprosy patients before and during treatment, but may also occur after the treatment is completed.3 Type-I reactions occur due to an increase in cell-mediated immunity which results in nerve inflammation at the point of mycobacterial infection. The skin lesions become tender and nerve involvement produces pain, abnormal sensation and functional impairment.4 Prompt intervention is required to prevent permanent nerve impairment since the expected rate of recovery for nerve function is 60–70%.5 Type-II reactions occur in multibacillary patients and are immune complex mediated. Patients with Type-II reactions develop tender, erythematous nodules on the face, trunk or legs.6 The treatment regimen for ENL is quite long and delayed treatment is an important cause of neuropathy and consequent disability.7 Thus, timely management of leprosy reactions is a big challenge and there is a need to understand the underlying complex immunological processes and gene expression.
Transcriptome profiling can be viewed as a vital approach in disseminating valuable information related to gene expression and associated host response to infection, assessing disease severity and discovering novel gene candidates for diagnosis and prognosis. Due to differences in experimental design and multiple hypotheses in individual studies, these differentially expressed genes (DEGs) should be interpreted accordingly.8 However, their combined analysis can unravel some common pathological mechanisms. In this study, the meta-analysis of individual datasets paved the way to integrate gene sets from multiple individual studies and work out a common list of DEGs for further biological investigation.9 In this study, leprosy reaction–specific datasets were analysed and integrated using meta-analysis to identify DEGs that could be considered as candidate biomarkers in leprosy pathogenesis. Further, the list of DEGs was subject to pathway analysis revealing vital processes and their likely association.
Type-I or reversal reaction represents an elevation in cellular immune response which progresses towards the tuberculoid pole of the disease. This type of reaction is common in borderline forms of leprosy and does not occur in the polar forms. The clinical expression of Type-I or reversal reaction includes an increase in the levels of activated lymphocytes which causes the existing skin lesions to become erythematous and oedematous. If it is very severe, then ulceration may occur at times. Peripheral nerves become enlarged and tender due to acute neuritis. It results in rapid loss of sensory and motor functions. The duration of the reversal reaction is often several weeks, but it may extend for many months.
Type-II reaction can be chronic and may occur in half of the patients with lepromatous or borderline lepromatous type of leprosy during the disease. The entire immunology of ENL is not yet completely understood but the condition is aggravated by immune complexes formed with Mycobacterium leprae antigens. The clinical expression includes neuritis, iridocyclitis, and painful skin lesions which are erythematous papules and nodules. Chronic ENL is associated with amyloidosis and glomerulonephritis and may cause mortality from renal insufficiency.
Methods
In the present study, we selected four high throughput sequencing and microarray datasets from a whole blood sample and skin biopsy of patients with adverse leprosy reactions from the GEO (Gene Expression Omnibus) database10 and investigated clinical biomarker candidates for early diagnosis and prognosis of immune reactions of leprosy based on functional and molecular pathway analyses of DEGs. We selected four datasets of whole blood samples from leprosy patients with immune reactions, GSE16844, GSE125943, GSE129033, and GSE74481, using the following keywords: ‘reversal reaction’, ‘leprosy’, ‘Homo sapiens,’ and ‘erythema nodosum leprosum’. These datasets were downloaded from the GEO database. The search results were examined and datasets were excluded if they consisted of (i) only the pathogen gene expression, (ii) only a single sample that does not allow comparison, (iii) treatment by any compound, and (iv) studies targeting only non-coding RNAs. Raw data were preferentially downloaded for the selected studies wherever possible; otherwise, the gene expression matrix was used. The datasets were included when (i) they consist of only host gene expression, (ii) they contain samples from either whole blood or skin biopsy and (iii) they target the mRNA. No studies were discarded due to differences in the sequencing platform, publication or experiment date, or unavailability of raw data as it would have further lowered the number of datasets available. A summary of the individual datasets is shown in Table 1. The workflow of the analysis is depicted in Figure 1.
| GEO Accession (Ref) | Organisms | Sample type | Sample group (n) | Platform | Comparison | Design of experiment/Key objective |
|---|---|---|---|---|---|---|
| GSE1684413 | Homo sapiens | Skin biopsy | LL (7), ENL (6) | Affymetrix Human Genome U133 Plus 2.0 Array | LL vs ENL | Mechanism of neutrophil recruitment in skin lesions of leprosy is investigated |
| GSE12594314 | Host- Homo sapiens, Pathogen-Mycobacterium leprae | Skin biopsy | LL (9), TT (6), RR (9) | Illumina HiSeq 2000 | LL vs RR | Dual RNA- sequencing was performed on the total RNA from 24 leprosy skin biopsy specimens |
| GSE12903315 | Homo sapiens | PBMC | ENL (4), RR (5), HC (3) | Illumina HiSeq 2500 | HC vs ENL; HC vs RR | RNA sequencing of PBMC enriched for myeloid derived suppressor cells from leprosy patients and HCs |
| GSE7448116 | Homo sapiens | Skin biopsy | TT (10), BT (10), BB (10), BL (10), LL (4), RR (14), ENL (9), HC (9) | Agilent SurePrint Human GE 8x60K Microarray | HC vs ENL; HC vs RR; LL vs RR; LL vs ENL | Samples from 67 leprosy patients and nine HC individuals were compared for differentially expressed genes |
GEO - Gene Expression Omnibus, LL - Lepromatous, ENL - Erythema nodosum leprosum, PBMC - Peripheral blood mononuclear cells, TT - Tuberculoid, BL - Borderline lepromatous, BB - Borderline borderline, BT - Borderline tuberculoid, HC - Healthy control, RR - Reversal reaction.
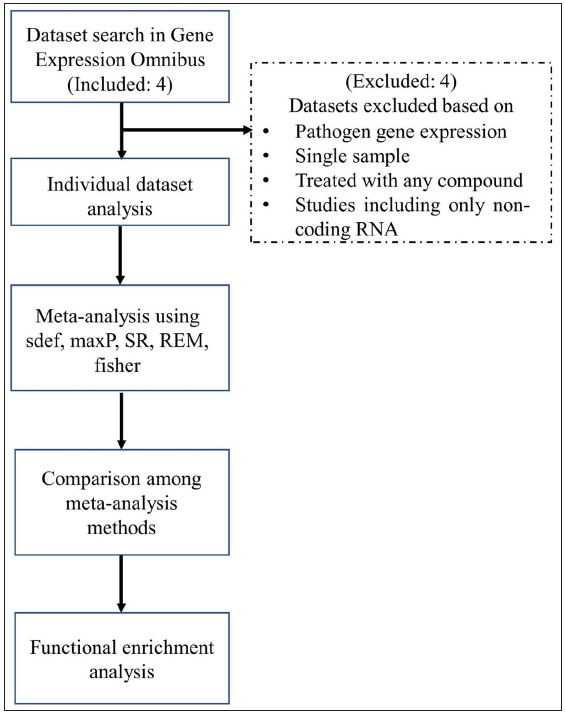
- Flowchart depicting the meta-analysis procedure. (SR - Sum of ranks, REM - Random effects model.)
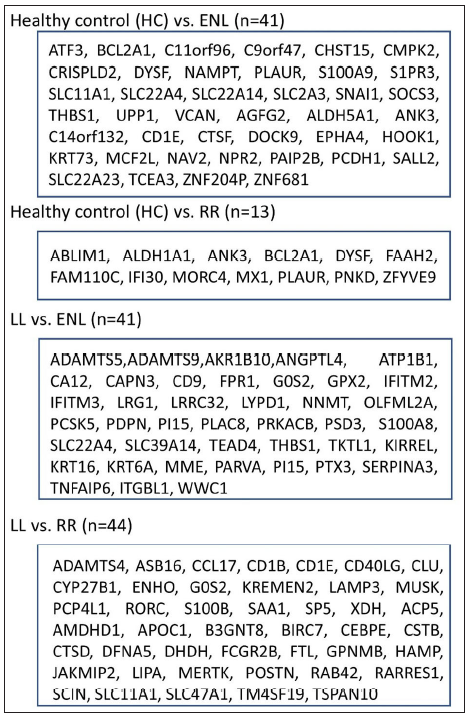
- Differentially expressed genes selected after the meta-analysis procedure for individual comparisons using multiple methods (sdef, maxP, SR, fisher), LL - Lepromatous leprosy, ENL - Erythema nodosum leprosum, SR - Sum of Ranks, RR - Reversal reaction, HC - Healthy control.
Identification of upregulated/downregulated differentially expressed genes from individual datasets
Upregulated or downregulated DEGs in the selected datasets were identified using the DESeq2 package11 in RStudio (Version 1.4.1106). Common up- or downregulated DEGs in the datasets were extracted. The cut-off criteria were set as – P-value < 0.05 and standardised |log2FC| > 1. Duplicate genes (mapped by Entrezid) were filtered based on the smallest mean expression across all samples in different studies. The resulting P-values were adjusted according to Benjamini and Hochberg’s (BH) method.12 Finally, all the ribosomal protein-coding genes were excluded from the expression matrix of genes.
Common differentially expressed genes from independent studies by ratio association method
To find common DEGs among datasets for related comparisons, a frequentist and Bayesian association ratio analysis was performed. The association of genes with similar comparisons is tested by a ratio measuring the relative increase of genes in common among different studies concerning the number of genes expected by chance, i.e., independence. The statistical significance of this ratio is assessed by Monte Carlo permutation which is a model devised in the Bayesian framework. Four categories were created including different studies with similar comparisons based on clinical features to find common DEGs. The following comparisons were created: (i) Healthy control (HC) vs ENL, (ii) HC vs Reversal reaction (RR), (iii) Lepromatous (LL) vs ENL, and (iv) LL vs RR. For each of these comparisons, the ratio of observed versus expected probability of occurrence of genes across different studies was computed based on frequentist and Bayesian methods as proposed in the sdef R package.17 We have selected HC vs ENL and HC vs RR comparisons to reveal any genes that have been expressed in HCs but may show downregulation in their expression during leprosy progression and further show deviated expression during adverse reactions. Hence, the basal level of expression can be determined.
Meta-analysis
As proposed by the developers of the sdef R package, it aims for fewer false positives when compared to other methods. Thus, a comparative approach was incorporated to compare genes with other standard meta-analysis methods with those obtained from the sdef method. MetaDE R package18 was used for differential gene expression. MetaDE package incorporates major meta-analysis methods such as Fisher, maximum P-value (maxP), the sum of ranks (SR), rth ordered P-value (roP), and random effects model (REM) which is based on effect sizes and are tested on the datasets used in this study. MetaDE also provides options for gene matching across studies and gene filtering before meta-analysis. In this study, P-value-based methods such as maxP, SR, and roP were used. Combining P-values from different studies has two major advantages: (i) simplicity and extensibility to different outcome variables and (ii) when the outcome variable is not binary then effect size may not be computed; however, P-value association among studies can still be calculated. In REM, the estimated effect size in each study is assumed to come from an underlying true effect size which also includes measurement errors like experimental or sampling error. Further, the studies also contain a random effect that can incorporate unknown cross-study heterogeneities in the model.19
Functional enrichment analysis of differentially expressed genes
Functional analysis of DEGs was carried out using the Gene Ontology (GO) database.20 GO and Kyoto Encyclopedia of Genes and Genomes (KEGG) analyses were performed using the Database for Annotation Visualisation and Integrated Discovery (DAVID).21 The cut-off criteria were set as – adjusted P-value < 0.1 and false discovery rate (FDR) < 0.001. Genes common from each comparison category were tested for enriched function from org.Hs.eg.db v 3.12.0 R package. To further explore the GO of selected genes, R package cluster profiler22 was used to explore the functions among genes of interest with a threshold value of adjusted P-value < 0.1. GO annotation contains three subcategories – biological process (BP), cellular component (CC), and molecular function (MF) – which identify the biological properties of all gene sets for all organisms.
Assessment of gene lists
The standardised log2FC, adjusted P-value and False Discovery Rate (FDR) is a vital set of metrics for genes expressed in studies. Thus, the genes found common from similar comparison categories from different studies were tabulated with their median log2FC (from sdef), adjusted P-value FDR, and tau2. The DEGs tabulated for HC vs ENL and LL vs ENL are shown in the main text [Tables 2 and 3] while for HC vs RR and LL vs RR are shown in Supplementary materials [Supplementary Table 1 & Supplementary Table 2].
| Entrez Id | Gene symbol | Log2FC | Adjusted P-value | FDR | Tau2 | Description |
|---|---|---|---|---|---|---|
| 3268 | AGFG2 | -3.03034 | 2.4E-05 | 0.0001 | 0.00 | ArfGAP with FG repeats 2 |
| 7915 | ALDH5A1 | -3.97772 | 4.42E-07 | 0.0001 | 0.00 | aldehyde dehydrogenase 5 family member A1 |
| 288 | ANK3 | -4.50756 | 8.6E-05 | 0.0001 | 0.00 | ankyrin 3 |
| 467 | ATF3 | 3.40186 | 4.83E-05 | 0.0001 | 0.00 | activating transcription factor 3 |
| 597 | BCL2A1 | 3.837651 | 5.83E-05 | 0.0001 | 0.00 | BCL2-related protein A1 |
| 387763 | C11orf96 | 6.544236 | 0.001494 | 0.0001 | 0.01 | chromosome 11 open reading frame 96 |
| 256967 | C14orf132 | -4.95844 | 0.000537 | 0.0001 | 0.01 | chromosome 14 open reading frame 132 |
| 286223 | C9orf47 | 8.481028 | 0.000145 | 0.0001 | 0.01 | chromosome 9 open reading frame 47 |
| 913 | CD1E | -5.39326 | 0.000294 | 0.0001 | 0.01 | CD1e molecule |
| 51363 | CHST15 | 3.29828 | 9.93E-05 | 0.0001 | 0.01 | carbohydrate sulphotransferase 15 |
| 129607 | CMPK2 | 3.400084 | 0.000283 | 0.0001 | 0.00 | cytidine/uridine monophosphate kinase 2 |
| 83716 | CRISPLD2 | 3.035294 | 8.34E-05 | 0.0006 | 0.01 | cysteine-rich secretory protein LCCL domain containing 2 |
| 8722 | CTSF | -3.70033 | 0.000742 | 0.0001 | 0.01 | cathepsin F |
| 23348 | DOCK9 | -3.03102 | 0.001262 | 0.0001 | 0.00 | dedicator of cytokinesis 9 |
| 8291 | DYSF | 3.740919 | 0.000209 | 0.0001 | 0.00 | dysferlin |
| 2043 | EPHA4 | -3.16614 | 0.000821 | 0.0001 | 0.01 | EPH receptor A4 |
| 51361 | HOOK1 | -3.75889 | 0.000183 | 0.0001 | 0.01 | hook microtubule tethering protein 1 |
| 319101 | KRT73 | -3.8575 | 0.001392 | 0.0001 | 0.00 | keratin 73 |
| 23263 | MCF2L | -4.78318 | 0.000257 | 0.0001 | 0.01 | MCF2 cell line–derived transforming sequence like |
| 10135 | NAMPT | 3.840097 | 5.96E-06 | 0.0001 | 0.01 | nicotinamide phosphoribosyltransferase |
| 89797 | NAV2 | -3.16788 | 0.000127 | 0.0001 | 0.00 | neuron navigator 2 |
| 4882 | NPR2 | -3.46004 | 0.000107 | 0.0001 | 0.01 | natriuretic peptide receptor 2 |
| 400961 | PAIP2B | -3.19456 | 6.82E-05 | 0.0001 | 0.01 | poly(A) binding protein interacting protein 2B |
| 5097 | PCDH1 | -5.97344 | 7.63E-05 | 0.0001 | 0.01 | protocadherin 1 |
| 5329 | PLAUR | 4.384652 | 8.6E-06 | 0.0001 | 0.00 | plasminogen activator, urokinase receptor |
| 6280 | S100A9 | 3.605774 | 1.36E-05 | 0.0001 | 0.00 | S100 calcium-binding protein A9 |
| 1903 | S1PR3 | 5.83001 | 8.21E-05 | 0.0005 | 0.00 | sphingosine-1-phosphate receptor 3 |
| 6297 | SALL2 | -4.16351 | 0.000644 | 0.0001 | 0.00 | Spalt-like transcription factor 2 |
| 6556 | SLC11A1 | 4.620372 | 2.81E-06 | 0.0001 | 0.01 | solute carrier family 11 member 1 |
| 63027 | SLC22A23 | -3.83493 | 4.11E-05 | 0.0006 | 0.01 | solute carrier family 22 member 23 |
| 6583 | SLC22A4 | 3.768588 | 4.36E-06 | 0.0006 | 0.01 | solute carrier family 22 member 4 |
| 144195 | SLC2A14 | 5.311251 | 0.000118 | 0.0006 | 0.01 | solute carrier family 2 member 14 |
| 6515 | SLC2A3 | 4.481587 | 6.05E-06 | 0.0006 | 0.01 | solute carrier family 2 member 3 |
| 6615 | SNAI1 | 5.011986 | 0.001273 | 0.0001 | 0.00 | snail family transcriptional repressor 1 |
| 9021 | SOCS3 | 4.515784 | 3.13E-05 | 0.0001 | 0.00 | suppressor of cytokine signalling 3 |
| 6920 | TCEA3 | -3.70372 | 4.15E-05 | 0.0001 | 0.00 | transcription elongation factor A3 |
| 7057 | THBS1 | 3.819743 | 5.45E-07 | 0.0001 | 0.01 | thrombospondin 1 |
| 7378 | UPP1 | 3.253603 | 0.000253 | 0.0001 | 0.01 | uridine phosphorylase 1 |
| 1462 | VCAN | 3.450314 | 0.000364 | 0.0001 | 0.01 | versican |
| 7754 | ZNF204P | -4.23346 | 0.000134 | 0.0001 | 0.01 | zinc finger protein 204, pseudogene |
| 148213 | ZNF681 | -3.52729 | 0.000121 | 0.0001 | 0.01 | zinc finger protein 681 |
FDR: False discovery rate; Tau2: Between-study variance; positive log2FC shows genes more expressed in HC, Negative log2FC shows genes more expressed in ENL.
HC - Healthy control, ENL - Erythema nodosum leprosum, FC - Fold change, FDR - False discovery rate, ArfGAP - Adenosine diphosphate ribosylation factor guanosine triphosphatase activating protein 2, EPH - ephrin, MCF2 - Malformations of cortical development, A1, A3, A4, A9 represents protein family member number of this particular protein.
| Entrez ID | Gene Symbol | Log2FC | Adjusted P-value | FDR | Tau2 | Description |
|---|---|---|---|---|---|---|
| 11096 | ADAMTS5 | −2.49503 | 0.000030995 | 0.0001 | 0.00 | ADAM metallopeptidase with thrombospondin type 1 motif 5 |
| 56999 | ADAMTS9 | −3.25833 | 0.000185 | 0.0001 | 0.00 | ADAM metallopeptidase with thrombospondin type 1 motif 9 |
| 57016 | AKR1B10 | −4.27945 | 0.000005835 | 0.0001 | 0.00 | Aldo-keto reductase family 1-member B10 |
| 51129 | ANGPTL4 | −2.11036 | 1.9375E-06 | 0.0001 | 0.01 | Angiopoietin-like 4 |
| 481 | ATP1B1 | 2.249928 | 0.00020495 | 0.0001 | 0.01 | ATPase Na+/K+ transporting subunit beta 1 |
| 771 | CA12 | −2.25835 | 0.000131 | 0.0001 | 0.00 | carbonic anhydrase 12 |
| 825 | CAPN3 | 2.138636 | 0.000489175 | 0.0001 | 0.00 | calpain 3 |
| 928 | CD9 | 2.105496 | 0.00034002 | 0.0001 | 0.00 | CD9 molecule |
| 2357 | FPR1 | −3.68784 | 0.0009527 | 0.0001 | 0.00 | formyl peptide receptor 1 |
| 50486 | G0S2 | −2.10941 | 0.000212861 | 0.0001 | 0.19 | G0/G1 switch 2 |
| 2877 | GPX2 | −2.65114 | 0.0010581 | 0.0001 | 0.18 | glutathione peroxidase 2 |
| 10581 | IFITM2 | −2.35419 | 0.000326705 | 0.0006 | 0.00 | interferon–induced transmembrane protein 2 |
| 10410 | IFITM3 | −2.49395 | 0.00370598 | 0.0006 | 0.00 | Interferon-induced transmembrane protein 3 |
| 9358 | ITGBL1 | 3.842573 | 0.00110255 | 0.0001 | 0.00 | integrin subunit beta like 1 |
| 55243 | KIRREL | −4.18249 | 0.0000497 | 0.0001 | 0.00 | kin of IRRE like |
| 3868 | KRT16 | −3.65565 | 9.10005E-06 | 0.0002 | 0.00 | keratin 16 |
| 3853 | KRT6A | −4.8273 | 1.59427E-06 | 0.0003 | 0.00 | keratin 6A |
| 116844 | LRG1 | −2.48456 | 0.00018025 | 0.0001 | 0.00 | Leucine-rich alpha-2-glycoprotein 1 |
| 2615 | LRRC32 | −2.50847 | 0.0004025 | 0.0001 | 0.00 | leucine-rich repeat containing 32 |
| 116372 | LYPD1 | −2.25438 | 0.00031155 | 0.0001 | 0.00 | LY6/PLAUR domain containing 1 |
| 4311 | MME | −3.22151 | 0.000918 | 0.0001 | 0.00 | membrane metalloendopeptidase |
| 4837 | NNMT | −2.81435 | 0.000094125 | 0.0001 | 0.00 | nicotinamide N-methyltransferase |
| 169611 | OLFML2A | 2.29638 | 0.00023675 | 0.0001 | 0.00 | Olfactomedin-like 2A |
| 55742 | PARVA | −3.0682 | 0.00020055 | 0.0001 | 0.00 | parvin alpha |
| 5125 | PCSK5 | −2.64075 | 0.00007895 | 0.0001 | 0.00 | proprotein convertase subtilisin/kexin type 5 |
| 10630 | PDPN | −2.79629 | 1.47685E-05 | 0.0001 | 0.00 | podoplanin |
| 51050 | PI15 | −3.29239 | 0.00003225 | 0.0001 | 0.00 | peptidase inhibitor 15 |
| 51316 | PLAC8 | −2.53294 | 0.0003115 | 0.0001 | 0.00 | placenta specific 8 |
| 5567 | PRKACB | 2.030238 | 0.0025442 | 0.0001 | 0.00 | protein kinase cAMP–activated catalytic subunit beta |
| 23362 | PSD3 | 2.194707 | 0.000054475 | 0.0001 | 0.00 | pleckstrin and Sec7 domain containing protein 3 |
| 5806 | PTX3 | −3.69717 | 0.000009125 | 0.0001 | 0.00 | pentraxin 3 |
| 7837 | PXDN | −2.80582 | 2.14699E-05 | 0.0001 | 0.00 | peroxidasin |
| 6279 | S100A8 | −2.91759 | 5.90029E-06 | 0.0001 | 0.00 | S100 calcium-binding protein A8 |
| 12 | SERPINA3 | −3.8388 | 0.0001885 | 0.0001 | 0.00 | serpin family A member 3 |
| 6583 | SLC22A4 | −2.0933 | 0.00009863 | 0.0008 | 0.00 | solute carrier family 22 member 4 |
| 23516 | SLC39A14 | −2.49318 | 0.000368546 | 0.0008 | 0.00 | solute carrier family 39 member 14 |
| 7004 | TEAD4 | −2.86874 | 0.0002165 | 0.0001 | 0.09 | TEA domain transcription factor 4 |
| 7057 | THBS1 | −2.07077 | 0.00327135 | 0.0001 | 0.09 | thrombospondin 1 |
| 8277 | TKTL1 | −2.14863 | 0.00009865 | 0.0001 | 0.00 | transketolase like 1 |
| 7130 | TNFAIP6 | −3.38789 | 0.000175003 | 0.0001 | 0.00 | TNF alpha–induced protein 6 |
| 23286 | WWC1 | −4.25724 | 0.00044245 | 0.0001 | 0.00 | WW and C2 domain containing protein 1 |
FDR: False discovery rate; Tau2: Between-study variance; positive log2FC shows genes more expressed in LL while negative log2FC denotes genes more expressed in ENL.
LL - Lepromatous leprosy, ENL - Erythema nodosum leprosum, FC - Fold change, FDR - False discovery rate, ADAM - A disintegrin-like and metalloprotease, LY6 - lymphocyte antigen 6, PLAUR - plasminogen activator, Urokinase receptor, AMP - adenosine monophosphate, TEA - Transcriptional enhancer factor, TNF - Tumour necrosis factor, PSD3 - pleckstrin and Sec7 domain containing protein 3, KIRREL - Kirre like nephrin family adhesion molecule, G0/G1 - Gap 0/Gap1.
Results
Dataset Search
A systematic search was conducted in GEO using specific keywords to identify leprosy reaction–related datasets. A total of eight datasets were found, of which only four were considered for individual analysis. Datasets with similar comparisons based on clinical features were grouped for analysis.
Identification of common differentially expressed genes using sdef and meta-analysis methods
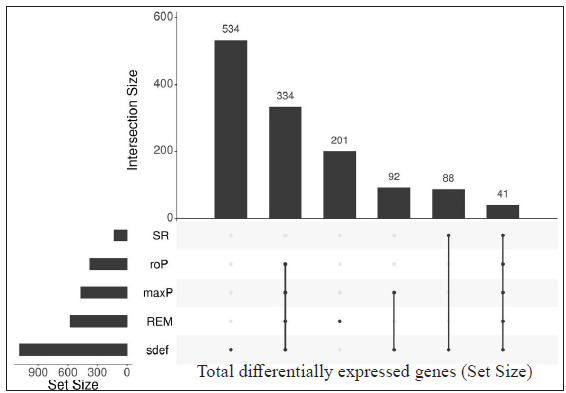
Individual datasets were processed to identify all the expressed genes. Then, similar comparisons from different datasets were considered to identify DEGs. Four similar comparisons from datasets were considered for ratio association analysis, namely, HC vs ENL, HC vs RR, LL vs ENL, and LL vs RR. Genes common to each study within the specific comparison were used in the ratio association test (sdef). Additional gene expression meta-analysis tools were used as described in the MetaDE R package, such as- rth ordered P-value (roP), sum of ranks (SR), and maximum P-value (maxP), among others. Figure 2 shows the upset plots representing the number of genes selected by each method along with their intersection with a false discovery rate (FDR) < 0.01. maxP and Fisher seems to be a more generous method in the selection of DEGs across comparisons. sdef analysis showed a significant association between the expressed genes in the datasets within each comparison category. Overall, the sdef method seems to be moderate in selection of genes. Other meta-analysis methods are quite conservative as they select fewer genes than the ratio association method. Table 2 represents the list of genes selected with |log2FC| > 3 and FDR < 0.001 in the HC vs ENL comparison. A total of 41 genes were selected by all four meta-analyses methods. maxP, fisher, and SR methods selected 29 genes. Top DEGs which are upregulated in HC individuals are ATF3, BCL2A1, C11orf96, C9orf47, CHST15, PLAUR and S100A9 while those more expressed in ENL are – AGFG2, ANK3, CD1E, CTSF, DOCK9, KRT73, NAV2, PCDH1, among others.
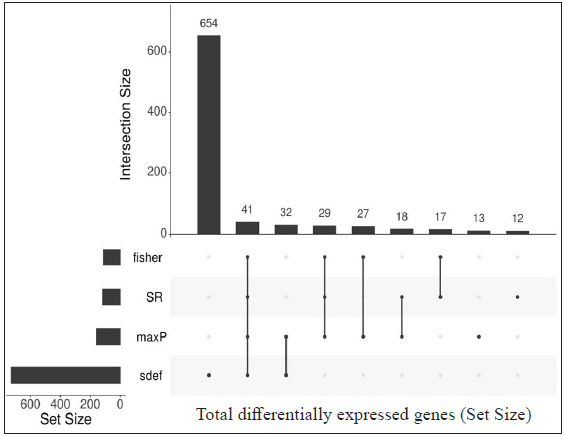
- Upset plots depicting the number of differentially expressed genes (DEGs) from each meta-analysis method and their intersection. The vertical bar represents the total number of expressed genes from different methods (intersection size) and the horizontal bar depicts the total gene size (set size) expressed by the meta-analysis method. DEGs from HC vs ENL comparison from two independent datasets (GSE129033 and GSE74481), 41 genes were identified by all the methods.
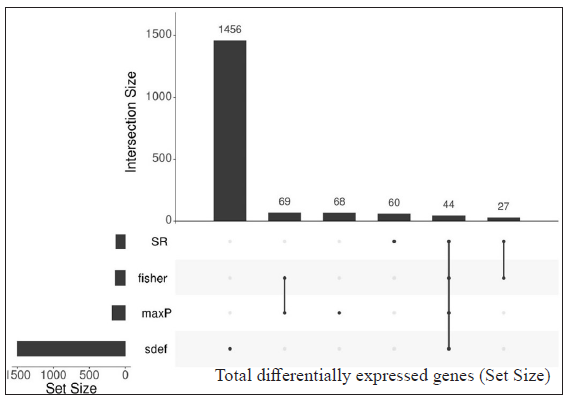
- Upset plots depicting the number of differentially expressed genes from each meta-analysis method and their intersection. Th vertical bar represents the total number of expressed genes from different methods (intersection size) and the horizontal bar depicts the total gene size (set size) expressed by the meta-analysis method. Genes from HC vs RR from two datasets (GSE129033 and GSE74481), 13 genes were found common by meta-analysis methods.
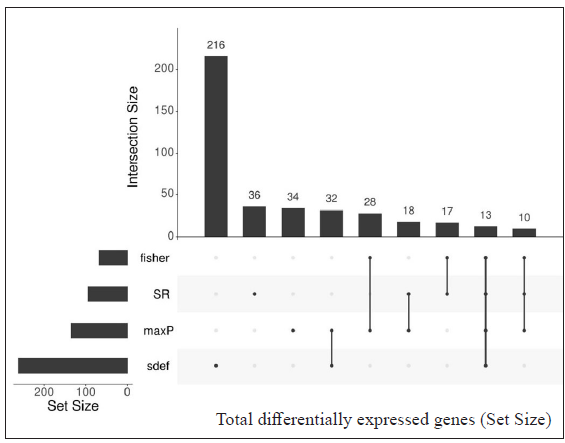
- Upset plots depicting the number of differentially expressed genes from each meta-analysis method and their intersection. The vertical bar represents the total number of expressed genes from different methods (intersection size) and the horizontal bar depicts the total gene size (set size) expressed by the meta-analysis method. Differentially expressed genes resulted from LL vs ENL comparison from two datasets (GSE16844 and GSE74481), 41 DEGs were found.
- Upset plots depicting the number of differentially expressed genes (DEGs) from each meta-analysis method and their intersection. The vertical bar represents the total number of expressed genes from different methods (intersection size) and the horizontal bar depicts the total gene size (set size) expressed by the meta-analysis method. DEGs from LL vs RR comparison (GSE125943 and GSE74481), a total of 44 DEGs were selected by all meta-analysis methods.
Table 3 represents the DEGs selected. A cut-off of |log2FC| > 2 and FDR < 0.001 in LL vs ENL is considered. A total of 334 genes were selected by the random effects model (REM) method excluding SR; however, 41 genes were found to be significant by all four methods along with REM. Genes that showed more expression in LL are ATP1B1, CD9, ITGBL1, PRKACB and PSD3 while genes more expressed in ENL are ADAMTS5, ADAMTS9, IFITM2, IFITM3, KIRREL, KRT16, KRT6A, PTX3, SERPINA3, SLC22A4, among others.
DEGs selected by all four methods (Fisher, SR, maxP, and sdef) in HC vs RR and LL vs RR comparison groups are shown in Supplementary Table 1 and Supplementary Table 2, respectively.
Comparison among groups considered in this study
The number of DEGs from the comparison groups such as HC vs ENL, HC vs RR, LL vs ENL, and LL vs RR were then further compared to reveal genes specific to an individual group such as healthy, LL, ENL, and RR. The DEGs that belong to HC, LL, ENL, and RR were found to be 2536, 2861, 2716 and 2585, respectively. The Venn diagram depicting the genes specific to individual groups and common to different groups is shown in Figure 3.
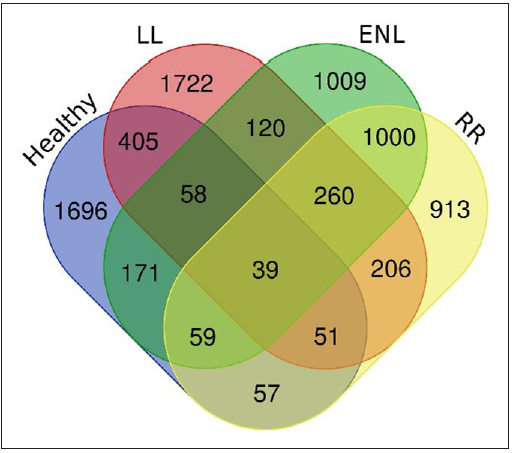
- Venn diagram depicting the number of differentially expressed genes specific to each group and common to these groups (healthy control, LL - Lepromatous, ENL - Erythema nodosum leprosum, RR - Reversal reaction).
Gene ontology and functional enrichment analysis
The list of DEGs from different studies across multiple comparisons is used to understand the biological role of these genes. In the HC vs ENL comparison, 41 genes were selected by all four methods with an FDR < 0.01, and standardised |log2FC| > 3 was used in the analysis. The top 20 GO-enriched BPs are shown in Figure 4 [Supplementary Table 3]. The expressed genes correspond to processes like ‘response to stress’, ‘negative regulation of apoptotic process’, ‘cytokine production’, ‘defense response,’ and ‘myeloid leukocyte activation’. However, analysis of genes more expressed in HC than ENL showed GO enriched terms such as – ‘cellular metabolic process’, ‘ion binding’, ‘membrane-bound organelle, and ‘intracellular’. Similarly, the ontologies enriched for genes more expressed in ENL than HC are the’cellular macromolecule metabolic process’, ‘protein metabolic process,’ and ‘heterocyclic compound binding’. The other enriched terms for genes in HC vs ENL comparison are shown in Supplementary Table 3.
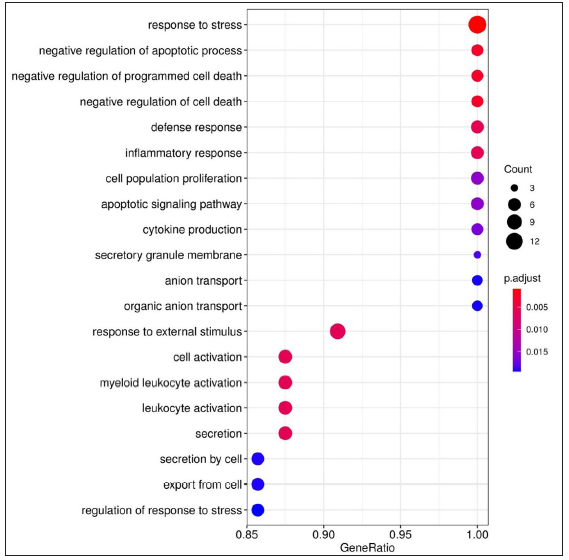
- Dot plots depicting the enriched Gene Ontology (GO) terms. GO terms denote the biological process, cellular component, and molecular function of the expressed genes. The X-axis shows the gene ratio, Y-axis denotes the enriched term. Adjusted P-value < 0.1 is set as a cut-off. The colour scale represents adjusted P-values and the size of the dot represents the gene number. Enriched terms for genes expressed in HC vs ENL comparison.
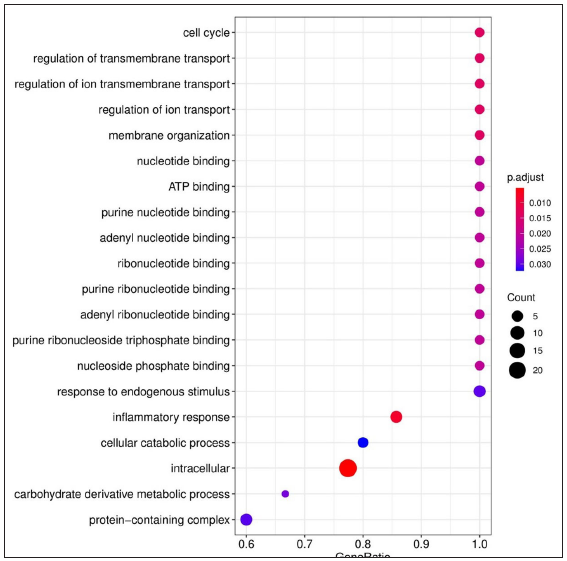
- Dot plots depicting the enriched Gene Ontology (GO) terms. GO terms denote the biological process, cellular component, and molecular function of the expressed genes. The X-axis shows the gene ratio, Y-axis denotes the enriched term. Adjusted P-value < 0.1 is set as a cut-off. The colour scale represents adjusted P-values and the size of the dot represents the gene number. Enriched terms from LL vs ENL comparison, ATP - Adenosine triphosphate.
For LL vs ENL comparison, overall 334 genes were expressed at a cut-off of standardised |log2FC| > 2 and FDR < 0.001. However, only 41 genes were found to be significant by all meta-analysis methods. Therefore, these 41 genes were used to understand their BPs. Functional enrichment analysis reveals the GO enriched BPs such as ‘cell cycle’, ‘regulation of ion transport’, ‘inflammatory response,’ and ‘response to endogenous stimulus’ which are indicative of host response against a pathogen. The top 20 enriched ontologies for genes differentially expressed in LL vs ENL are shown in Figure 4 [Supplementary Table 4]. Genes specific to a particular GO enriched term for HC vs ENL and LL vs ENL comparison sets are shown in Figure 4. Heat plots showing the enriched terms for identified genes based on standardised log2FC for comparison HC vs ENL and LL vs ENL are shown in Figure 5. Figure 6 represents an overview of the meta-analysis of the datasets representing the two types of leprosy reactions: Type-I (Reversal Reactions) and Type-II (Erythema Nodosum Leprosum).
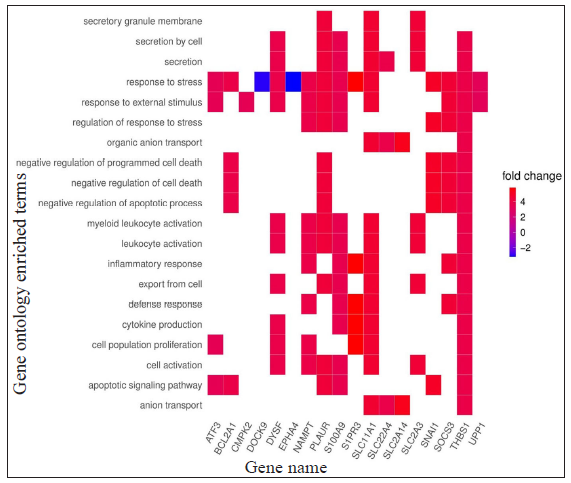
- Heat plots showing enriched genes with specific GO terms according to the standardised log2FC for HC vs ENL comparison; positive log2FC denotes genes more expressed in HC individuals while negative log2FC denotes genes more expressed in ENL patients.
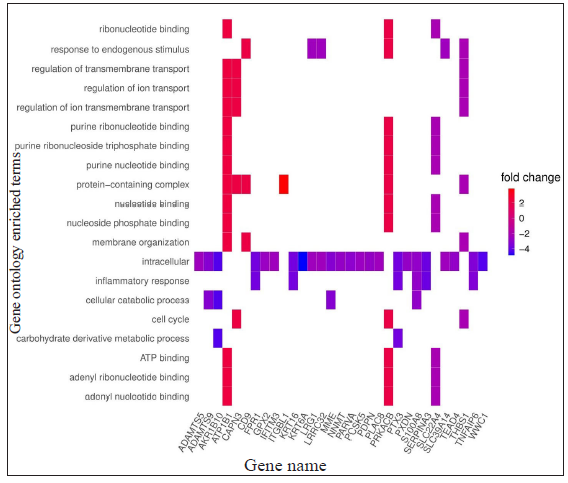
- Heat plots showing enriched genes with specific GO terms according to the standardised log2FC for LL vs ENL comparison; positive log2FC denotes genes more expressed in LL while negative log2FC denotes genes more expressed in ENL patients.
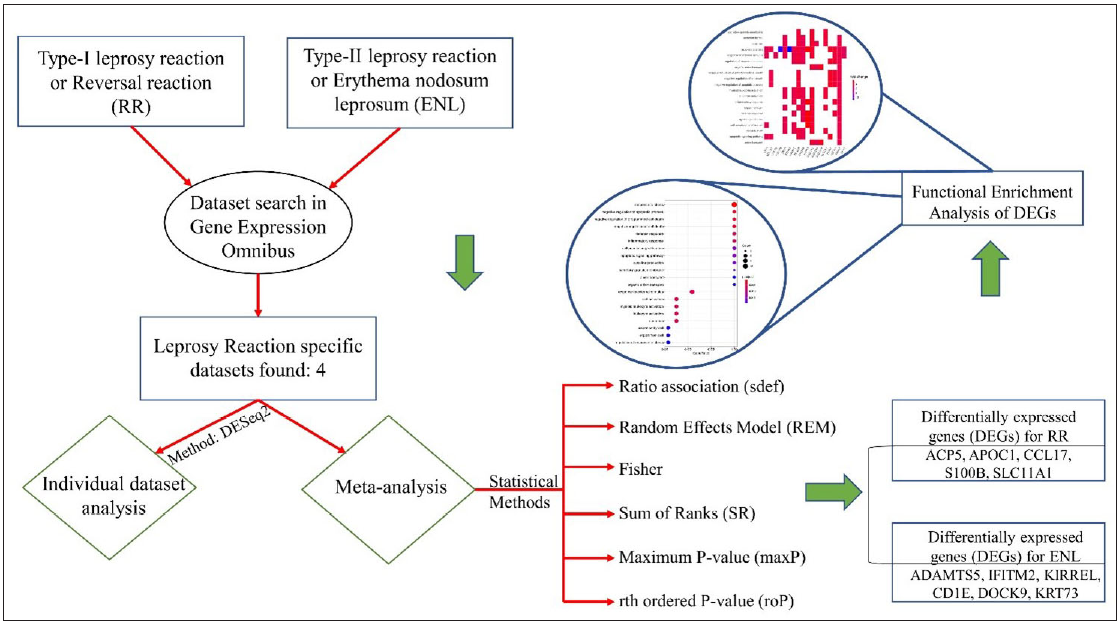
- The overview of the meta-analysis of the datasets representing Type-I and Type-II leprosy reactions. RR- Reversal reaction, DEGs - Differentially expressed genes, ENL - Erythema nodosum leprosum.
We have identified several DEGs more expressed in RR than in HC such as ABLIM1, ANK3, FAM110C, and MORC4 while those less expressed in RR as compared to HC like BCL2A1, IFI30, and PLAUR and they correspond to GO enriched terms like cellular aldehyde metabolic process and cell surface receptor signalling pathway [Supplementary Table 5]. The genes that resulted from LL vs RR, namely, APOC1, CSTB, FTL, SLC11A1, and TSPAN10 are more expressed in RR than LL and not described in the literature earlier. ADAMTS4, CCL17, CD1B, CD1E, and G0S2 among others are more expressed in LL than RR [Supplementary Table 6]. A major class of genes expressed in LL belongs to chemokines and plays a significant role in recruiting neutrophils and lymphocytes to the mycobacterium-infected site.23 The GO terms for LL vs RR comparison are immune system process cell communication, and signal transduction which are representative of the need for the cell to generate an immune response and would be essential to understand the immunopathogenesis of the disease. Gene ontology- enriched terms for DEGs in LL vs RR and HC vs RR are shown in Supplementary Table 5 and Supplementary Table 6, respectively. CCL17 and CYP27B1 seem to be more expressed in LL patients and are also reported to have no significant correlation with Type-I reaction 24 while MERTK showed higher expression in RR patients [Supplementary Figure 1].
Discussion
Leprosy reactions play a major role in morbidities associated with the disease. These immune reactions lead to nerve damage, and weakness and pose a great risk of injury and deformity.2 These immune-mediated complications occur in more than 50% of leprosy patients.6 The pathological mechanisms of these immune reactions are complex and have not yet been completely understood. Comparative host transcriptomics has immense utility in elucidating screening profiles and is capable of efficiently narrowing down the candidate genes associated with multifactorial diseases like leprosy and investigates the underlying mechanisms of immune reactions for their diagnosis and prognosis. In this study, publicly available datasets from GEO were considered for analysis. The datasets specific to leprosy Type-I and Type-II reactions were identified based on search terms. Individual analysis of these datasets revealed statistically significant DEGs. Integration of these individual studies based on a common comparison pattern was carried out using meta-analysis statistical methods to find common expression patterns across studies. Datasets that resulted from both the microarray and RNA sequencing platforms were included to ensure that no specific dataset is left out merely because of variation in the experimental platform being used. At last, we identified a list of DEGs in each comparison set across different studies which are indicative of their possible role in progression and immune exacerbations in leprosy. Therefore, such common genes can be prioritised as their functional validation would be useful because they are consistently identified across multiple studies.
The criteria used for identifying the differential expression are based on adjusted P-value and standardised fold-change or effect size.25 However, the hypothesis testing depends on the sample size, and studies with less sample size do not or had fewer differentially expressed genes, and thus chances of getting false-positives and false-negatives are expected. When a gene is identified as differentially expressed in one study, it might not necessarily be statistically significant in other unless that gene is biologically replicated. If a gene is selected by the major meta-analysis methods, such as maxP, SR, Fisher, and sdef, then the chances of it being a false-positive are less likely. Also, if a gene is statistically significant in one study, it might not be necessarily picked up by all methods in a meta-analysis by virtue of differences in P-values or effect size as it is not consistent across studies. This corresponds to the fact that only a small proportion of the genes were selected by these methods over those that only differentially expressed in one or few studies.
Only studying the final set of DEGs from individual studies might limit the discoverability of other potential genes as certain factors contribute to making it biased. For example, the statistical framework used in an individual study might differ; all genes from one study might not be expressed in another on account of different platforms in use, etc. Thus, analysis of individual studies removes these biases and helps to incorporate a common statistical method for them to reach a balanced comparable conclusion.
The meta-analysis methods used in this study are based on the P-value or effect size of expressed genes and thus help to reveal DEGs not identified earlier.26 The potential role of these genes can be identified using functional analysis or previously defined pathways relevant to the host response to leprosy. Some of the identified genes have been previously reported in studies relevant to leprosy like PTX3 which showed a higher expression in ENL,27 S100A9 which is more expressed in HC than in the ENL cases and generates an ineffective response to leprosy.28 GO enrichment analysis of lists of DEGs from HC vs ENL reveals the BPs involved in the inflammatory response, cell population proliferation, and cytokine production. Moreover, a similar profile is seen in GO-enriched BPs from LL vs ENL comparison. It represents terms like inflammatory response, membrane organisation, and regulation of transmembrane transport which connotes genes such as SLC11A1 and showed higher expression in ENL patients.29
This study unleashes several potential biomarker candidate genes that may serve the purpose of early detection of reactions in leprosy patients. Over the years, several genes were associated with ENL, for example, Pentraxin-3 (PTX3) which is a protein present in secondary neutrophilic granules and is a potential biomarker of ENL. According to this study, it shows a downregulation in expression from its normal levels. PTX3 can be used to differentiate between episodes of ENL from a reversal reaction. Another gene SLC11A1, a member of the solute carrier family, encodes a protein called natural resistance–associated macrophage protein 1(NRAMP1 or SNP 274C/T) which is associated with leprosy reaction. The presence of the ‘C’ allele becomes a risk factor for Type-I reaction; however, it becomes protective for Type-II reaction. A class of interferons was also identified as a part of candidate biomarkers which constitute a range of cytokines performing multifaceted roles. In this study, IFITM2 and IFITM3 are shown to be upregulated in ENL as also confirmed by other studies.
The gene expression can be validated by techniques such as the qPCR (quantitative polymerase chain reaction). It is quite interesting to note that the analysis of several microarray and RNA sequencing datasets by different people generating analogous results is indicative of a true differential expression. However, proper replication of these findings would be required to rule out any bias.30
Conclusion
This study analyses immune reactions in leprosy-specific datasets publicly available in GEO using a standardised approach, thereby revealing the DEGs common among different studies. Integration of DEGs from individual studies using meta-analysis reveals several genes that are vital in understanding the mechanisms of immune reactions and their possible correlation with the host response. We have identified several genes ADAMTS5, ADAMTS9, IFITM2, IFITM3, KIRREL, ANK3, CD1E, CTSF, DOCK9, and KRT73 to name a few which can serve as potential biomarkers for Type-II reaction. For Type-I reaction, DEGs are identified as ACP5, APOC1, CCL17, S100B, and SLC11A1 among others, and may likely serve as biomarkers. Further, the analysed studies imply some important BPs which help in getting insights into the pathogenesis of reactions in leprosy. A combination of biomarkers would be necessary for its early diagnosis or prognosis to be used for clinical applications.
Ethical approval
The Institutional Review Board approval is not required as this article does not contain any studies with human participants or animals performed by any of the authors.
Declaration of patient consent
Patient’s consent not required as there are no patients in this study.
Financial support and sponsorship
The research work in the laboratory of Pushpendra Singh was supported by the Indian Council of Medical Research (ICMR); Department of Biotechnology (DBT); Research to Stop Neglected Tropical Diseases Transmission (R2STOP), Canada; Turing Foundation & Leprosy Research Initiative (LRI), The Netherlands.
Conflicts of interest
There are no conflicts of interest.
Use of artificial intelligence (AI)-assisted technology for manuscript preparation
The authors confirm that there was no use of artificial intelligence (AI)-assisted technology for assisting in the writing or editing of the manuscript and no images were manipulated using AI.
References
- Inflammatory mediators of leprosy reactional episodes and dental infections: A systematic review. Mediators Inflamm. 2015;2015:548540.
- [CrossRef] [PubMed] [PubMed Central] [Google Scholar]
- Diagnosis and treatment of leprosy reactions in integrated services--the patients’ perspective in Nepal. PLoS Negl Trop Dis. 2013;7:e2089.
- [CrossRef] [PubMed] [PubMed Central] [Google Scholar]
- Clinical pearls: Leprosy reactions. J Cutan Med Surg. 2016;20:484-5.
- [CrossRef] [PubMed] [Google Scholar]
- Leprosy type 1 reactions and erythema nodosum leprosum. An Bras Dermatol. 2008;83:75-82.
- [CrossRef] [Google Scholar]
- 3. Immunology of leprosy. Trans R Soc Trop Med Hyg. 1993;87:508-14.
- [CrossRef] [PubMed] [Google Scholar]
- The continuing challenges of leprosy. Clin Microbiol Rev. 2006;19:338-81.
- [CrossRef] [PubMed] [PubMed Central] [Google Scholar]
- Corticosteroids for treating nerve damage in leprosy. A Cochrane review. Lepr Rev. 2008;79:361-71.
- [PubMed] [Google Scholar]
- Microarray data analysis: From disarray to consolidation and consensus. Nat Rev Genet. 2006;7:55-65.
- [CrossRef] [PubMed] [Google Scholar]
- Methods to increase reproducibility in differential gene expression via meta-analysis. Nucleic Acids Res. 2016;45:e1.
- [CrossRef] [PubMed] [PubMed Central] [Google Scholar]
- Gene Expression Omnibus. Available from https://www.ncbi.nlm.nih.gov/geo/ [Last accessed on 2023 November 22].
- Moderated estimation of fold change and dispersion for RNA-seq data with DESeq2. Genome Biol. 2014;15:550.
- [CrossRef] [PubMed] [PubMed Central] [Google Scholar]
- Controlling the false discovery rate: A practical and powerful approach to multiple testing. J R Stat Soc, Ser B, Methodol. 1995;57:289-300.
- [CrossRef] [Google Scholar]
- Integrated pathways for neutrophil recruitment and inflammation in leprosy. J Infect Dis. 2010;201:558-69.
- [CrossRef] [PubMed] [PubMed Central] [Google Scholar]
- Dual RNA-Seq of human leprosy lesions identifies bacterial determinants linked to host immune response. Cell Rep. 2019;26:3574-85.e3.
- [CrossRef] [PubMed] [PubMed Central] [Google Scholar]
- ER stress regulates immunosuppressive function of myeloid derived suppressor cells in leprosy that can be overcome in the presence of IFN-γ. iScience. 2020;23:101050.
- [CrossRef] [PubMed] [PubMed Central] [Google Scholar]
- Genome-wide screening of mRNA expression in leprosy patients. Front Genet. 2015;6:334.
- [CrossRef] [PubMed] [PubMed Central] [Google Scholar]
- sdef: an R package to synthesize lists of significant features in related experiments. BMC Bioinformatics. 2010;11:270.
- [CrossRef] [PubMed] [PubMed Central] [Google Scholar]
- An R package suite for microarray meta-analysis in quality control, differentially expressed gene analysis and pathway enrichment detection. Bioinformatics (Oxford, England). 2012;28:2534-6.
- [CrossRef] [PubMed] [PubMed Central] [Google Scholar]
- Comprehensive literature review and statistical considerations for microarray meta-analysis. Nucleic Acids Res. 2012;40:3785-99.
- [CrossRef] [PubMed] [PubMed Central] [Google Scholar]
- The Gene Ontology Resource. Available from: http://geneontology.org/ [Last accessed in 2023 November 22].
- DAVID Bioinformatics Resources 6.8. Available from: https://david.ncifcrf.gov/ [Last accessed in 2023 November 22].
- clusterProfiler: an R package for comparing biological themes among gene clusters. OMICS A journal of integrative biology. 2012;16:284-7.
- [CrossRef] [PubMed] [PubMed Central] [Google Scholar]
- Leprosy patients with lepromatous disease have an up-regulated IL-8 response that is unlinked to TNF-alpha responses. Int J Lepr Other Mycobact Dis. 2004;72:35-44.
- [CrossRef] [PubMed] [Google Scholar]
- Differential dermal expression of CCL17 and CCL18 in tuberculoid and lepromatous leprosy. PLoS Negl Trop Dis. 2014;8:e3263.
- [CrossRef] [PubMed] [PubMed Central] [Google Scholar]
- Comprehensive evaluation of differential gene expression analysis methods for RNA-seq data. Genome Biology. 2013;14:3158.
- [CrossRef] [PubMed] [PubMed Central] [Google Scholar]
- Meta-analysis methods for combining multiple expression profiles: comparisons, statistical characterization and an application guideline. BMC Bioinformatics. 2013;14:368.
- [CrossRef] [PubMed] [PubMed Central] [Google Scholar]
- Elevated pentraxin-3 concentrations in patients with leprosy: potential biomarker of erythema nodosum leprosum. J Infect Dis. 2017;216:1635-43.
- [CrossRef] [PubMed] [Google Scholar]
- High expression of myeloid-related proteins 8 and 14 characterizes an inflammatorily active but ineffective response of macrophages during leprosy. Immunology. 2004;111:472-80.
- [CrossRef] [PubMed] [PubMed Central] [Google Scholar]
- Susceptibility to leprosy is linked to the human NRAMP1 gene. J Infect Dis. 1998;177:133-45.
- [CrossRef] [PubMed] [Google Scholar]
- Reanalysis and integration of public microarray datasets reveals novel host genes modulated in leprosy. Mol Genet Genomics. 2020;295:1355-68.
- [CrossRef] [PubMed] [Google Scholar]